Capital One 2012 Annual Report Download - page 99
Download and view the complete annual report
Please find page 99 of the 2012 Capital One annual report below. You can navigate through the pages in the report by either clicking on the pages listed below, or by using the keyword search tool below to find specific information within the annual report.-
 1
1 -
2
-
3
-
4
-
5
-
6
-
7
-
8
-
9
-
10
-
11
-
12
-
13
-
14
-
15
-
16
-
17
-
18
-
19
-
20
-
21
-
22
-
23
-
24
-
25
-
26
-
27
-
28
-
29
-
30
-
31
-
32
-
33
-
34
-
35
-
36
-
37
-
38
-
39
-
40
-
41
-
42
-
43
-
44
-
45
-
46
-
47
-
48
-
49
-
50
-
51
-
52
-
53
-
54
-
55
-
56
-
57
-
58
-
59
-
60
-
61
-
62
-
63
-
64
-
65
-
66
-
67
-
68
-
69
-
70
-
71
-
72
-
73
-
74
-
75
-
76
-
77
-
78
-
79
-
80
-
81
-
82
-
83
-
84
-
85
-
86
-
87
-
88
-
 89
89 -
 90
90 -
 91
91 -
 92
92 -
 93
93 -
 94
94 -
 95
95 -
 96
96 -
 97
97 -
 98
98 -
 99
99 -
 100
100 -
 101
101 -
 102
102 -
 103
103 -
 104
104 -
 105
105 -
 106
106 -
 107
107 -
 108
108 -
 109
109 -
110
-
111
-
112
-
113
-
114
-
115
-
116
-
117
-
118
-
119
-
120
-
121
-
122
-
123
-
124
-
125
-
126
-
127
-
128
-
129
-
130
-
131
-
132
-
133
-
134
-
135
-
136
-
137
-
138
-
139
-
140
-
141
-
142
-
143
-
144
-
145
-
146
-
147
-
148
-
149
-
150
-
151
-
152
-
153
-
154
-
155
-
156
-
157
-
158
-
159
-
160
-
161
-
162
-
163
-
164
-
165
-
166
-
167
-
168
-
169
-
170
-
171
-
172
-
173
-
174
-
175
-
176
-
177
-
178
-
179
-
180
-
181
-
182
-
183
-
184
-
185
-
186
-
187
-
188
-
189
-
190
-
191
-
192
-
193
-
194
-
195
-
196
-
197
-
198
-
199
-
200
-
201
-
202
-
203
-
204
-
205
-
206
-
207
-
208
-
209
-
210
-
211
-
212
-
213
-
214
-
215
-
216
-
217
-
218
-
219
-
220
-
221
-
222
-
223
-
224
-
225
-
226
-
227
-
228
-
229
-
230
-
231
-
232
-
233
-
234
-
235
-
236
-
237
-
238
-
239
-
240
-
241
-
242
-
243
-
244
-
245
-
246
-
247
-
248
-
249
-
250
-
251
-
252
-
253
-
254
-
255
-
256
-
257
-
258
-
259
-
260
-
261
-
262
-
263
-
264
-
265
-
266
-
267
-
268
-
269
-
270
-
271
-
272
-
273
-
274
-
275
-
276
-
277
-
278
-
279
-
280
-
281
-
282
-
283
-
284
-
285
-
286
-
287
-
288
-
289
-
290
-
291
-
292
-
293
-
294
-
295
-
296
-
297
-
298
-
299
-
300
-
301
-
302
-
303
-
304
-
305
-
306
-
307
-
308
-
309
-
310
-
311
 |
 |

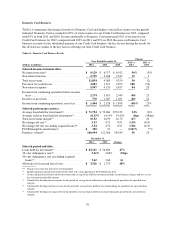
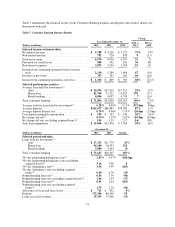
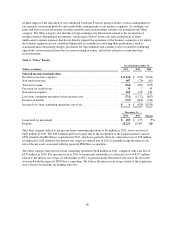
residual impact of the allocation of our centralized Corporate Treasury group activities, such as management of
our corporate investment portfolio and asset/liability management, to our business segments. Accordingly, net
gains and losses on our investment securities portfolio and certain trading activities are included in the Other
category. The Other category also includes foreign exchange-rate fluctuations related to the revaluation of
foreign currency-denominated investments; certain gains (losses) on the sale and securitization of loans;
unallocated corporate expenses that do not directly support the operations of the business segments or for which
the business segments are not considered financially accountable in evaluating their performance, such as
acquisition and restructuring charges; provisions for representation and warranty reserves related to continuing
operations; certain material items that are non-recurring in nature; and offsets related to certain line-item
reclassifications.
Table 9: “Other” Results
Year Ended December 31,
(Dollars in millions) 2012 2011 2010
Selected income statement data:
Net interest income (expense) .......................................... $ (1,121) $ (913) $(614)
Non-interest income .................................................. 607 (74) (61)
Total net revenue .................................................... (514) (987) (675)
Provision for credit losses .............................................. 35 7 43
Non-interest expense ................................................. 162 128 149
Loss from continuing operations before income taxes ........................ (711) (1,122) (867)
Income tax benefit ................................................... (717) (694) (534)
Income (loss) from continuing operations, net of tax ......................... $6$ (428) $(333)
December 31,
2012 2011 Change
Loans held for investment ............................................. $ 187 $ 175 7%
Deposits ........................................................... 10,223 13,003 (21)
The Other category shifted to net income from continuing operations of $6 million in 2012, from a net loss of
$428 million in 2011. The $434 million shift was largely due to the recognition of the bargain purchase gain of
$594 related to the ING Direct acquisition in 2012, which was partially offset by a derivative loss of $78 million
recognized in 2012 related to the interest rate swaps we entered into in 2011 to partially hedge the interest rate
risk of the net assets associated with the expected ING Direct acquisition.
The Other category had a net loss from continuing operations $428 million in 2011, compared with a net loss of
$333 million in 2010. The increased loss in 2011 was primarily attributable to a derivative loss of $277 million
related to the interest rate swaps we entered into in 2011 to partially hedge the interest rate risk of the net assets
associated with the expected ING Direct acquisition. We believe the interest-rate swaps related to the acquisition
were effective in meeting our hedging objective.
80