Capital One 2012 Annual Report Download - page 123
Download and view the complete annual report
Please find page 123 of the 2012 Capital One annual report below. You can navigate through the pages in the report by either clicking on the pages listed below, or by using the keyword search tool below to find specific information within the annual report.-
 1
1 -
2
-
3
-
4
-
5
-
6
-
7
-
8
-
9
-
10
-
11
-
12
-
13
-
14
-
15
-
16
-
17
-
18
-
19
-
20
-
21
-
22
-
23
-
24
-
25
-
26
-
27
-
28
-
29
-
30
-
31
-
32
-
33
-
34
-
35
-
36
-
37
-
38
-
39
-
40
-
41
-
42
-
43
-
44
-
45
-
46
-
47
-
48
-
49
-
50
-
51
-
52
-
53
-
54
-
55
-
56
-
57
-
58
-
59
-
60
-
61
-
62
-
63
-
64
-
65
-
66
-
67
-
68
-
69
-
70
-
71
-
72
-
73
-
74
-
75
-
76
-
77
-
78
-
79
-
80
-
81
-
82
-
83
-
84
-
85
-
86
-
87
-
88
-
89
-
90
-
91
-
92
-
93
-
94
-
95
-
96
-
97
-
98
-
99
-
100
-
101
-
102
-
103
-
104
-
105
-
106
-
107
-
108
-
109
-
110
-
111
-
112
-
 113
113 -
 114
114 -
 115
115 -
 116
116 -
 117
117 -
 118
118 -
 119
119 -
 120
120 -
 121
121 -
 122
122 -
 123
123 -
 124
124 -
 125
125 -
 126
126 -
 127
127 -
 128
128 -
 129
129 -
 130
130 -
 131
131 -
 132
132 -
 133
133 -
134
-
135
-
136
-
137
-
138
-
139
-
140
-
141
-
142
-
143
-
144
-
145
-
146
-
147
-
148
-
149
-
150
-
151
-
152
-
153
-
154
-
155
-
156
-
157
-
158
-
159
-
160
-
161
-
162
-
163
-
164
-
165
-
166
-
167
-
168
-
169
-
170
-
171
-
172
-
173
-
174
-
175
-
176
-
177
-
178
-
179
-
180
-
181
-
182
-
183
-
184
-
185
-
186
-
187
-
188
-
189
-
190
-
191
-
192
-
193
-
194
-
195
-
196
-
197
-
198
-
199
-
200
-
201
-
202
-
203
-
204
-
205
-
206
-
207
-
208
-
209
-
210
-
211
-
212
-
213
-
214
-
215
-
216
-
217
-
218
-
219
-
220
-
221
-
222
-
223
-
224
-
225
-
226
-
227
-
228
-
229
-
230
-
231
-
232
-
233
-
234
-
235
-
236
-
237
-
238
-
239
-
240
-
241
-
242
-
243
-
244
-
245
-
246
-
247
-
248
-
249
-
250
-
251
-
252
-
253
-
254
-
255
-
256
-
257
-
258
-
259
-
260
-
261
-
262
-
263
-
264
-
265
-
266
-
267
-
268
-
269
-
270
-
271
-
272
-
273
-
274
-
275
-
276
-
277
-
278
-
279
-
280
-
281
-
282
-
283
-
284
-
285
-
286
-
287
-
288
-
289
-
290
-
291
-
292
-
293
-
294
-
295
-
296
-
297
-
298
-
299
-
300
-
301
-
302
-
303
-
304
-
305
-
306
-
307
-
308
-
309
-
310
-
311
 |
 |

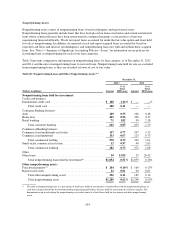
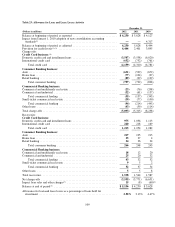
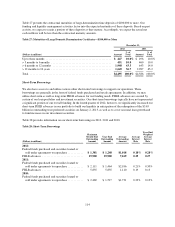
Nonperforming Assets
Nonperforming assets consist of nonperforming loans, foreclosed property and repossessed assets.
Nonperforming loans generally include loans that have been placed on nonaccrual status and certain restructured
loans whose contractual terms have been restructured in a manner that grants a concession to a borrower
experiencing financial difficulty. We do not report loans accounted for under the fair value option and loans held
for sale as nonperforming. In addition, we separately track and report acquired loans accounted for based on
expected cash flows and disclose our delinquency and nonperforming loan rates with and without these acquired
loans. See “Note 1—Summary of Significant Accounting Policies—Loans” for information on our policies for
classifying loans as nonperforming for each of our loan categories.
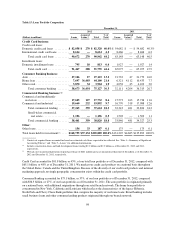
Table 20 presents comparative information on nonperforming loans, by loan category, as of December 31, 2012
and 2011, and the ratio of nonperforming loans to our total loans. Nonperforming loans held for sale are excluded
from nonperforming loans, as they are recorded at lower of cost or fair value.
Table 20: Nonperforming Loans and Other Nonperforming Assets(1)(2)
(Dollars in millions)
December 31,
2012(3) 2011
Amount
% of
Total
HFI Loans Amount
% of
Total
HFI Loans
Nonperforming loans held for investment:
Credit card business:
International credit card ..................................... $ 100 1.16% $ — —%
Total credit card ....................................... 100 0.11 ——
Consumer Banking business:
Auto .................................................... 149 0.55 106 0.48
Home loan ............................................... 422 0.96 456 4.37
Retail banking ............................................ 71 1.82 90 2.18
Total consumer banking ................................ 642 0.85 652 1.79
Commercial Banking business:
Commercial and multifamily real estate ........................ 137 0.77 207 1.32
Commercial and industrial .................................. 133 0.67 125 0.73
Total commercial lending ............................... 270 0.72 332 1.01
Small-ticket commercial real estate ............................ 12 0.97 40 2.63
Total commercial banking ............................... 282 0.73 372 1.08
Other:
Other loans ............................................... 30 15.85 35 20.42
Total nonperforming loans held for investment(4) ............. $1,054 0.51% $1,059 0.78%
Other nonperforming assets:
Foreclosed property(5) ...................................... $ 204 0.10% $ 169 0.13%
Repossessed assets ......................................... 22 0.01 20 0.01
Total other nonperforming assets ......................... 226 0.11 189 0.14
Total nonperforming assets .............................. $1,280 0.62% $1,248 0.92%
(1) The ratio of nonperforming loans as a percentage of total loans held for investment is calculated based on the nonperforming loans in
each loan category divided by the total outstanding unpaid principal balance of loans held for investment in each loan category. The
denominator used in calculating the nonperforming asset ratios consists of total loans held for investment and other nonperforming
assets.
104