Capital One 2012 Annual Report Download - page 183
Download and view the complete annual report
Please find page 183 of the 2012 Capital One annual report below. You can navigate through the pages in the report by either clicking on the pages listed below, or by using the keyword search tool below to find specific information within the annual report.-
 1
1 -
2
-
3
-
4
-
5
-
6
-
7
-
8
-
9
-
10
-
11
-
12
-
13
-
14
-
15
-
16
-
17
-
18
-
19
-
20
-
21
-
22
-
23
-
24
-
25
-
26
-
27
-
28
-
29
-
30
-
31
-
32
-
33
-
34
-
35
-
36
-
37
-
38
-
39
-
40
-
41
-
42
-
43
-
44
-
45
-
46
-
47
-
48
-
49
-
50
-
51
-
52
-
53
-
54
-
55
-
56
-
57
-
58
-
59
-
60
-
61
-
62
-
63
-
64
-
65
-
66
-
67
-
68
-
69
-
70
-
71
-
72
-
73
-
74
-
75
-
76
-
77
-
78
-
79
-
80
-
81
-
82
-
83
-
84
-
85
-
86
-
87
-
88
-
89
-
90
-
91
-
92
-
93
-
94
-
95
-
96
-
97
-
98
-
99
-
100
-
101
-
102
-
103
-
104
-
105
-
106
-
107
-
108
-
109
-
110
-
111
-
112
-
113
-
114
-
115
-
116
-
117
-
118
-
119
-
120
-
121
-
122
-
123
-
124
-
125
-
126
-
127
-
128
-
129
-
130
-
131
-
132
-
133
-
134
-
135
-
136
-
137
-
138
-
139
-
140
-
141
-
142
-
143
-
144
-
145
-
146
-
147
-
148
-
149
-
150
-
151
-
152
-
153
-
154
-
155
-
156
-
157
-
158
-
159
-
160
-
161
-
162
-
163
-
164
-
165
-
166
-
167
-
168
-
169
-
170
-
171
-
172
-
 173
173 -
 174
174 -
 175
175 -
 176
176 -
 177
177 -
 178
178 -
 179
179 -
 180
180 -
 181
181 -
 182
182 -
 183
183 -
 184
184 -
 185
185 -
 186
186 -
 187
187 -
 188
188 -
 189
189 -
 190
190 -
 191
191 -
 192
192 -
 193
193 -
194
-
195
-
196
-
197
-
198
-
199
-
200
-
201
-
202
-
203
-
204
-
205
-
206
-
207
-
208
-
209
-
210
-
211
-
212
-
213
-
214
-
215
-
216
-
217
-
218
-
219
-
220
-
221
-
222
-
223
-
224
-
225
-
226
-
227
-
228
-
229
-
230
-
231
-
232
-
233
-
234
-
235
-
236
-
237
-
238
-
239
-
240
-
241
-
242
-
243
-
244
-
245
-
246
-
247
-
248
-
249
-
250
-
251
-
252
-
253
-
254
-
255
-
256
-
257
-
258
-
259
-
260
-
261
-
262
-
263
-
264
-
265
-
266
-
267
-
268
-
269
-
270
-
271
-
272
-
273
-
274
-
275
-
276
-
277
-
278
-
279
-
280
-
281
-
282
-
283
-
284
-
285
-
286
-
287
-
288
-
289
-
290
-
291
-
292
-
293
-
294
-
295
-
296
-
297
-
298
-
299
-
300
-
301
-
302
-
303
-
304
-
305
-
306
-
307
-
308
-
309
-
310
-
311
 |
 |

CAPITAL ONE FINANCIAL CORPORATION
NOTES TO CONSOLIDATED FINANCIAL STATEMENTS—(Continued)
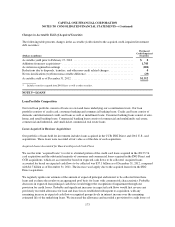
The loss from discontinued operations includes an expense of $307 million ($194 million net of tax), $169
million ($120 million net of tax), and $432 million ($304 million net of tax) in 2012, 2011 and 2010,
respectively, attributable to provisions for mortgage loan repurchase losses related to representations and
warranties provided on loans previously sold to third parties by the wholesale mortgage banking unit. See “Note
21—Commitments, Contingencies and Guarantees” for further details.
The discontinued mortgage origination operations of our wholesale mortgage banking unit had remaining assets, which
consisted primarily of income tax receivables, of $309 million and $304 million as of December 31, 2012 and 2011,
respectively. Liabilities totaled $644 million and $680 million as of December 31, 2012 and 2011, respectively,
consisting primarily of reserves for representations and warranties on loans previously sold to third parties.
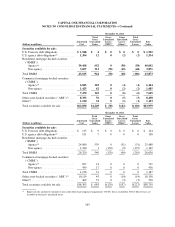
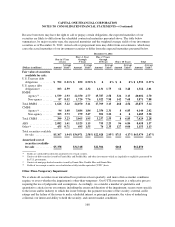
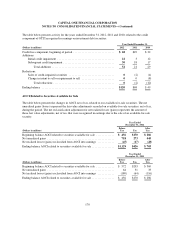
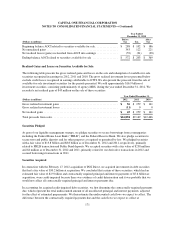
NOTE 4—INVESTMENT SECURITIES
Our portfolio of investment securities available for sale, which had a fair value of $64.0 billion and $38.8 billion
as of December 31, 2012, and 2011, respectively, consisted primarily of the following: U.S. Treasury and U.S.
agency debt obligations; agency and non-agency mortgage-backed securities (“MBS”); other asset-backed
securities, and other investments. Based on fair value, investments in U.S. Treasury, agency securities and other
securities explicitly or implicitly guaranteed by the U.S. Government represented 77% of our total investment
securities available for sale as of December 31, 2012 and 2011, respectively.
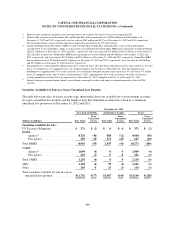
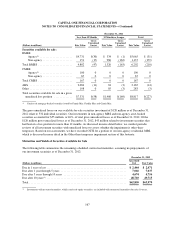
Securities at Amortized Cost and Fair Value
Substantially all of our investment securities were classified as available for sale as of December 31, 2012 and
reported in our consolidated balance sheets at fair value. In 2012, we purchased $9 million of securities that we
designated as held to maturity. These securities are included in other assets in our consolidated balance sheets.
The following tables present the amortized cost, fair value and corresponding gross unrealized gains (losses), by
major security type, for our investment securities as of December 31, 2012 and 2011. The gross unrealized gains
(losses) related to our available-for-sale investment securities are recorded, net of tax, as a component of
accumulated other comprehensive income (“AOCI”).
164