Capital One 2012 Annual Report Download - page 133
Download and view the complete annual report
Please find page 133 of the 2012 Capital One annual report below. You can navigate through the pages in the report by either clicking on the pages listed below, or by using the keyword search tool below to find specific information within the annual report.-
 1
1 -
2
-
3
-
4
-
5
-
6
-
7
-
8
-
9
-
10
-
11
-
12
-
13
-
14
-
15
-
16
-
17
-
18
-
19
-
20
-
21
-
22
-
23
-
24
-
25
-
26
-
27
-
28
-
29
-
30
-
31
-
32
-
33
-
34
-
35
-
36
-
37
-
38
-
39
-
40
-
41
-
42
-
43
-
44
-
45
-
46
-
47
-
48
-
49
-
50
-
51
-
52
-
53
-
54
-
55
-
56
-
57
-
58
-
59
-
60
-
61
-
62
-
63
-
64
-
65
-
66
-
67
-
68
-
69
-
70
-
71
-
72
-
73
-
74
-
75
-
76
-
77
-
78
-
79
-
80
-
81
-
82
-
83
-
84
-
85
-
86
-
87
-
88
-
89
-
90
-
91
-
92
-
93
-
94
-
95
-
96
-
97
-
98
-
99
-
100
-
101
-
102
-
103
-
104
-
105
-
106
-
107
-
108
-
109
-
110
-
111
-
112
-
113
-
114
-
115
-
116
-
117
-
118
-
119
-
120
-
121
-
122
-
 123
123 -
 124
124 -
 125
125 -
 126
126 -
 127
127 -
 128
128 -
 129
129 -
 130
130 -
 131
131 -
 132
132 -
 133
133 -
 134
134 -
 135
135 -
 136
136 -
 137
137 -
 138
138 -
 139
139 -
 140
140 -
 141
141 -
 142
142 -
 143
143 -
144
-
145
-
146
-
147
-
148
-
149
-
150
-
151
-
152
-
153
-
154
-
155
-
156
-
157
-
158
-
159
-
160
-
161
-
162
-
163
-
164
-
165
-
166
-
167
-
168
-
169
-
170
-
171
-
172
-
173
-
174
-
175
-
176
-
177
-
178
-
179
-
180
-
181
-
182
-
183
-
184
-
185
-
186
-
187
-
188
-
189
-
190
-
191
-
192
-
193
-
194
-
195
-
196
-
197
-
198
-
199
-
200
-
201
-
202
-
203
-
204
-
205
-
206
-
207
-
208
-
209
-
210
-
211
-
212
-
213
-
214
-
215
-
216
-
217
-
218
-
219
-
220
-
221
-
222
-
223
-
224
-
225
-
226
-
227
-
228
-
229
-
230
-
231
-
232
-
233
-
234
-
235
-
236
-
237
-
238
-
239
-
240
-
241
-
242
-
243
-
244
-
245
-
246
-
247
-
248
-
249
-
250
-
251
-
252
-
253
-
254
-
255
-
256
-
257
-
258
-
259
-
260
-
261
-
262
-
263
-
264
-
265
-
266
-
267
-
268
-
269
-
270
-
271
-
272
-
273
-
274
-
275
-
276
-
277
-
278
-
279
-
280
-
281
-
282
-
283
-
284
-
285
-
286
-
287
-
288
-
289
-
290
-
291
-
292
-
293
-
294
-
295
-
296
-
297
-
298
-
299
-
300
-
301
-
302
-
303
-
304
-
305
-
306
-
307
-
308
-
309
-
310
-
311
 |
 |

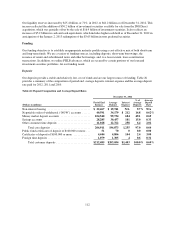
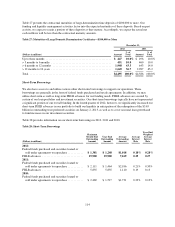
Table 27 presents the contractual maturities of large-denomination time deposits of $100,000 or more. Our
funding and liquidity management activities factor into the expected maturities of these deposits. Based on past
activity, we expect to retain a portion of these deposits as they mature. Accordingly, we expect the actual net
cash outflows will be less than the contractual maturity amounts.
Table 27: Maturities of Large Domestic Denomination Certificates—$100,000 or More
December 31,
2012 2011
(Dollars in millions) Amount
% of
Total Amount
% of
Total
Up to three months .............................................. $ 447 10.0% $ 496 10.8%
> 3 months to 6 months .......................................... 451 10.0 460 10.0
> 6 months to 12 months ......................................... 1,948 43.3 643 14.0
> 12 months to 10 years .......................................... 1,649 36.7 2,987 65.2
Total ......................................................... $4,495 100.0% $4,586 100.0%
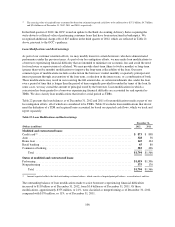
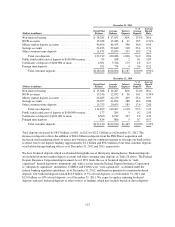
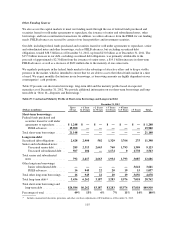
Short-Term Borrowings
We also have access to and utilize various other short-term borrowings to support our operations. These
borrowings are generally in the form of federal funds purchased and resale agreements. In addition, we may
utilize short-term as well as long-term FHLB advances for our funding needs. FHLB advances are secured by
certain of our loan portfolios and investment securities. Our short-term borrowings typically have not represented
a significant portion of our overall funding. In the fourth quarter of 2012, however, we significantly increased our
short-term FHLB advances in our portfolio to build our liquidity in anticipation of the redemption of the $3.65
billion in outstanding trust preferred securities on January 2, 2013, as well as to cover seasonal loan growth and
to fund increases in our investment securities.
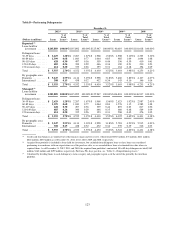
Table 28 provides information on our short-term borrowings in 2012, 2011 and 2010.
Table 28: Short-Term Borrowings
(Dollars in millions)
Maximum
Month-End
Outstanding
Amount
Year-End
Outstanding
Amount
Average
Outstanding
Amount
Average
Interest
Rate
Year-End
Weighted
Average
Interest
Rate
2012:
Federal funds purchased and securities loaned or
sold under agreements to repurchase ........... $ 1,381 $ 1,248 $1,018 0.18% 0.28%
FHLB advances ............................. 19,900 19,900 7,169 0.25 0.27
2011:
Federal funds purchased and securities loaned or
sold under agreements to repurchase ........... $ 2,111 $ 1,464 $2,186 0.21% 0.30%
FHLB advances ............................. 5,835 5,835 1,110 0.19 0.13
2010:
Federal funds purchased and securities loaned or
sold under agreements to repurchase ........... $ 2,469 $ 1,517 $1,731 0.23% 0.13%
114