Capital One 2012 Annual Report Download - page 96
Download and view the complete annual report
Please find page 96 of the 2012 Capital One annual report below. You can navigate through the pages in the report by either clicking on the pages listed below, or by using the keyword search tool below to find specific information within the annual report.-
 1
1 -
2
-
3
-
4
-
5
-
6
-
7
-
8
-
9
-
10
-
11
-
12
-
13
-
14
-
15
-
16
-
17
-
18
-
19
-
20
-
21
-
22
-
23
-
24
-
25
-
26
-
27
-
28
-
29
-
30
-
31
-
32
-
33
-
34
-
35
-
36
-
37
-
38
-
39
-
40
-
41
-
42
-
43
-
44
-
45
-
46
-
47
-
48
-
49
-
50
-
51
-
52
-
53
-
54
-
55
-
56
-
57
-
58
-
59
-
60
-
61
-
62
-
63
-
64
-
65
-
66
-
67
-
68
-
69
-
70
-
71
-
72
-
73
-
74
-
75
-
76
-
77
-
78
-
79
-
80
-
81
-
82
-
83
-
84
-
85
-
 86
86 -
 87
87 -
 88
88 -
 89
89 -
 90
90 -
 91
91 -
 92
92 -
 93
93 -
 94
94 -
 95
95 -
 96
96 -
 97
97 -
 98
98 -
 99
99 -
 100
100 -
 101
101 -
 102
102 -
 103
103 -
 104
104 -
 105
105 -
 106
106 -
107
-
108
-
109
-
110
-
111
-
112
-
113
-
114
-
115
-
116
-
117
-
118
-
119
-
120
-
121
-
122
-
123
-
124
-
125
-
126
-
127
-
128
-
129
-
130
-
131
-
132
-
133
-
134
-
135
-
136
-
137
-
138
-
139
-
140
-
141
-
142
-
143
-
144
-
145
-
146
-
147
-
148
-
149
-
150
-
151
-
152
-
153
-
154
-
155
-
156
-
157
-
158
-
159
-
160
-
161
-
162
-
163
-
164
-
165
-
166
-
167
-
168
-
169
-
170
-
171
-
172
-
173
-
174
-
175
-
176
-
177
-
178
-
179
-
180
-
181
-
182
-
183
-
184
-
185
-
186
-
187
-
188
-
189
-
190
-
191
-
192
-
193
-
194
-
195
-
196
-
197
-
198
-
199
-
200
-
201
-
202
-
203
-
204
-
205
-
206
-
207
-
208
-
209
-
210
-
211
-
212
-
213
-
214
-
215
-
216
-
217
-
218
-
219
-
220
-
221
-
222
-
223
-
224
-
225
-
226
-
227
-
228
-
229
-
230
-
231
-
232
-
233
-
234
-
235
-
236
-
237
-
238
-
239
-
240
-
241
-
242
-
243
-
244
-
245
-
246
-
247
-
248
-
249
-
250
-
251
-
252
-
253
-
254
-
255
-
256
-
257
-
258
-
259
-
260
-
261
-
262
-
263
-
264
-
265
-
266
-
267
-
268
-
269
-
270
-
271
-
272
-
273
-
274
-
275
-
276
-
277
-
278
-
279
-
280
-
281
-
282
-
283
-
284
-
285
-
286
-
287
-
288
-
289
-
290
-
291
-
292
-
293
-
294
-
295
-
296
-
297
-
298
-
299
-
300
-
301
-
302
-
303
-
304
-
305
-
306
-
307
-
308
-
309
-
310
-
311
 |
 |

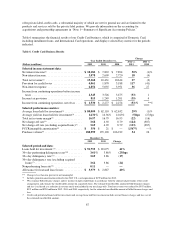
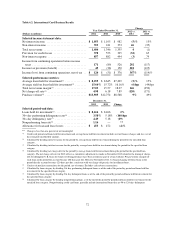
December 31, 2010. The improvement in the net charge-off rate reflected the impact from strong underlying
credit performance trends and higher credit quality of more recent auto loan vintages, as well as favorable
benefits from elevated auction prices.
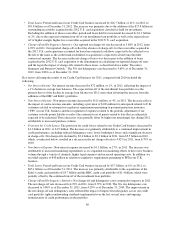
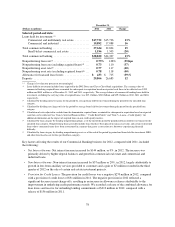
Commercial Banking Business
Our Commercial Banking business generated net income from continuing operations of $835 million in 2012,
compared with net income from continuing operations of $595 million and $204 million in 2011 and 2010,
respectively. The primary sources of revenue for our Commercial Banking business are net interest income from
loans and deposits and non-interest income from customer fees. Because we have some affordable housing tax-
related investments that generate tax-exempt income or tax credits, we make certain reclassifications to our
Commercial Banking business results to present revenues on a taxable-equivalent basis. Expenses primarily
consist of ongoing operating costs, such as salaries and associate benefits, occupancy and equipment,
professional services and communications and data processing technology expenses, as well as marketing
expenditures.
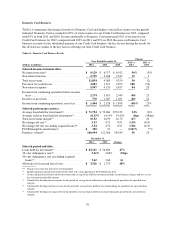
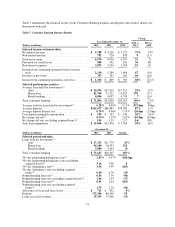
Table 8 summarizes the financial results of our Commercial Banking business and displays selected key metrics
for the periods indicated.
Table 8: Commercial Banking Business Results
(Dollars in millions)
Change
Year Ended December 31, 2012 vs.
2011
2011 vs.
20102012 2011 2010
Selected income statement data:
Net interest income ............................... $ 1,740 $ 1,596 $ 1,450 9% 10%
Non-interest income .............................. 340 283 185 20 53
Total net revenue ................................ 2,080 1,879 1,635 11 15
Provision for credit losses ......................... (270) 31 435 (971) (93)
Non-interest expense ............................. 1,059 925 884 14 5
Income from continuing operations before income
taxes ........................................ 1,291 923 316 40 192
Income tax provision ............................. 456 328 112 39 193
Income from continuing operations, net of tax ......... $ 835 $ 595 $ 204 40% 192%
Selected performance metrics:
Average loans held for investment:(1)
Commercial and multifamily real estate .......... $16,256 $14,166 $ 13,712 15% 3%
Commercial and industrial ..................... 18,304 15,437 14,058 19 10
Total commercial lending .......................... 34,560 29,603 27,770 17 7
Small-ticket commercial real estate .............. 1,353 1,671 1,994 (19) (16)
Total commercial banking ......................... $35,913 $31,274 $ 29,764 15% 5%
Average yield on loans held for investment(2) .......... 4.25% 4.74% 5.05% (49)bps (31)bps
Average deposits ................................ $28,266 $25,033 $ 22,228 13% 13%
Average deposit interest rate ....................... 0.32% 0.49% 0.66% (17)bps (17)bps
Core deposit intangible amortization ................. $ 34 $ 40 $ 55 (15)% (27)%
Net charge-off rate(3) .............................. 0.12% 0.57% 1.31% (45)bps (74)bps
Net charge-off rate (excluding acquired loans)(4) ........ 0.12 0.58 1.34 (46)bps (76)bps
77