Capital One 2012 Annual Report Download - page 249
Download and view the complete annual report
Please find page 249 of the 2012 Capital One annual report below. You can navigate through the pages in the report by either clicking on the pages listed below, or by using the keyword search tool below to find specific information within the annual report.-
 1
1 -
2
-
3
-
4
-
5
-
6
-
7
-
8
-
9
-
10
-
11
-
12
-
13
-
14
-
15
-
16
-
17
-
18
-
19
-
20
-
21
-
22
-
23
-
24
-
25
-
26
-
27
-
28
-
29
-
30
-
31
-
32
-
33
-
34
-
35
-
36
-
37
-
38
-
39
-
40
-
41
-
42
-
43
-
44
-
45
-
46
-
47
-
48
-
49
-
50
-
51
-
52
-
53
-
54
-
55
-
56
-
57
-
58
-
59
-
60
-
61
-
62
-
63
-
64
-
65
-
66
-
67
-
68
-
69
-
70
-
71
-
72
-
73
-
74
-
75
-
76
-
77
-
78
-
79
-
80
-
81
-
82
-
83
-
84
-
85
-
86
-
87
-
88
-
89
-
90
-
91
-
92
-
93
-
94
-
95
-
96
-
97
-
98
-
99
-
100
-
101
-
102
-
103
-
104
-
105
-
106
-
107
-
108
-
109
-
110
-
111
-
112
-
113
-
114
-
115
-
116
-
117
-
118
-
119
-
120
-
121
-
122
-
123
-
124
-
125
-
126
-
127
-
128
-
129
-
130
-
131
-
132
-
133
-
134
-
135
-
136
-
137
-
138
-
139
-
140
-
141
-
142
-
143
-
144
-
145
-
146
-
147
-
148
-
149
-
150
-
151
-
152
-
153
-
154
-
155
-
156
-
157
-
158
-
159
-
160
-
161
-
162
-
163
-
164
-
165
-
166
-
167
-
168
-
169
-
170
-
171
-
172
-
173
-
174
-
175
-
176
-
177
-
178
-
179
-
180
-
181
-
182
-
183
-
184
-
185
-
186
-
187
-
188
-
189
-
190
-
191
-
192
-
193
-
194
-
195
-
196
-
197
-
198
-
199
-
200
-
201
-
202
-
203
-
204
-
205
-
206
-
207
-
208
-
209
-
210
-
211
-
212
-
213
-
214
-
215
-
216
-
217
-
218
-
219
-
220
-
221
-
222
-
223
-
224
-
225
-
226
-
227
-
228
-
229
-
230
-
231
-
232
-
233
-
234
-
235
-
236
-
237
-
238
-
 239
239 -
 240
240 -
 241
241 -
 242
242 -
 243
243 -
 244
244 -
 245
245 -
 246
246 -
 247
247 -
 248
248 -
 249
249 -
 250
250 -
 251
251 -
 252
252 -
 253
253 -
 254
254 -
 255
255 -
 256
256 -
 257
257 -
 258
258 -
 259
259 -
260
-
261
-
262
-
263
-
264
-
265
-
266
-
267
-
268
-
269
-
270
-
271
-
272
-
273
-
274
-
275
-
276
-
277
-
278
-
279
-
280
-
281
-
282
-
283
-
284
-
285
-
286
-
287
-
288
-
289
-
290
-
291
-
292
-
293
-
294
-
295
-
296
-
297
-
298
-
299
-
300
-
301
-
302
-
303
-
304
-
305
-
306
-
307
-
308
-
309
-
310
-
311
 |
 |

CAPITAL ONE FINANCIAL CORPORATION
NOTES TO CONSOLIDATED FINANCIAL STATEMENTS—(Continued)
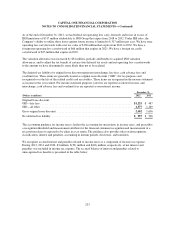
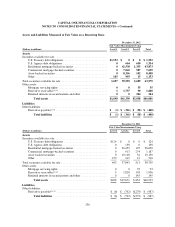
Plan Assets Measured at Fair Value on a Recurring Basis
December 31, 2012
Fair Value Measurements Using Assets
at Fair
Value(Dollars in millions) Level 1 Level 2 Level 3
Plan Assets
Common collective trusts ..................................... $0 $136 $0 $136
Money market fund ......................................... 0 10 1
Corporate bonds (S&P rating of A or higher) ..................... 0 14 0 14
Corporate bonds (S&P rating of lower than A) .................... 0 26 0 26
Government securities ....................................... 0 39 0 39
Mortgage-backed securities ................................... 0 14 0 14
Municipal bonds ............................................ 0 10 1
Total ................................................. $0 $231 $0 $231
December 31, 2011
Fair Value Measurements Using Assets
at Fair
Value(Dollars in millions) Level 1 Level 2 Level 3
Plan Assets
Common collective trusts ..................................... $0 $125 $0 $125
Money market fund ......................................... 0 0 0 0
Corporate bonds (S&P rating of A or higher) ..................... 0 12 0 12
Corporate bonds (S&P rating of lower than A) .................... 0 22 0 22
Government securities ....................................... 0 46 0 46
Mortgage-backed securities ................................... 0 15 0 15
Municipal bonds ............................................ 0 1 0 1
Total ................................................. $0 $221 $0 $221
Financial instruments are considered Level 3 when their values are determined using pricing models, which
include comparison of prices from multiple sources, discounted cash flow methodologies or similar techniques
and at least one significant model assumption or input is unobservable or there is significant variability among
pricing sources. Level 3 financial instruments also include those for which the determination of fair value
requires significant management judgment or estimation. We did not have any Level 3 plan assets for the years
ended December 31, 2012 and 2011.
Expected future benefit payments
The following benefit payments, which reflect expected future service, as appropriate, are expected to be paid:
(Dollars in millions)
Pension
Benefits
Postretirement
Benefits
2013 ................................................................... $13 $ 3
2014 ................................................................... 13 4
2015 ................................................................... 12 4
2016 ................................................................... 12 4
2017 ................................................................... 12 4
2018 - 2022 ............................................................. 59 20
230