Capital One 2012 Annual Report Download - page 56
Download and view the complete annual report
Please find page 56 of the 2012 Capital One annual report below. You can navigate through the pages in the report by either clicking on the pages listed below, or by using the keyword search tool below to find specific information within the annual report.-
 1
1 -
2
-
3
-
4
-
5
-
6
-
7
-
8
-
9
-
10
-
11
-
12
-
13
-
14
-
15
-
16
-
17
-
18
-
19
-
20
-
21
-
22
-
23
-
24
-
25
-
26
-
27
-
28
-
29
-
30
-
31
-
32
-
33
-
34
-
35
-
36
-
37
-
38
-
39
-
40
-
41
-
42
-
43
-
44
-
45
-
 46
46 -
 47
47 -
 48
48 -
 49
49 -
 50
50 -
 51
51 -
 52
52 -
 53
53 -
 54
54 -
 55
55 -
 56
56 -
 57
57 -
 58
58 -
 59
59 -
 60
60 -
 61
61 -
 62
62 -
 63
63 -
 64
64 -
 65
65 -
 66
66 -
67
-
68
-
69
-
70
-
71
-
72
-
73
-
74
-
75
-
76
-
77
-
78
-
79
-
80
-
81
-
82
-
83
-
84
-
85
-
86
-
87
-
88
-
89
-
90
-
91
-
92
-
93
-
94
-
95
-
96
-
97
-
98
-
99
-
100
-
101
-
102
-
103
-
104
-
105
-
106
-
107
-
108
-
109
-
110
-
111
-
112
-
113
-
114
-
115
-
116
-
117
-
118
-
119
-
120
-
121
-
122
-
123
-
124
-
125
-
126
-
127
-
128
-
129
-
130
-
131
-
132
-
133
-
134
-
135
-
136
-
137
-
138
-
139
-
140
-
141
-
142
-
143
-
144
-
145
-
146
-
147
-
148
-
149
-
150
-
151
-
152
-
153
-
154
-
155
-
156
-
157
-
158
-
159
-
160
-
161
-
162
-
163
-
164
-
165
-
166
-
167
-
168
-
169
-
170
-
171
-
172
-
173
-
174
-
175
-
176
-
177
-
178
-
179
-
180
-
181
-
182
-
183
-
184
-
185
-
186
-
187
-
188
-
189
-
190
-
191
-
192
-
193
-
194
-
195
-
196
-
197
-
198
-
199
-
200
-
201
-
202
-
203
-
204
-
205
-
206
-
207
-
208
-
209
-
210
-
211
-
212
-
213
-
214
-
215
-
216
-
217
-
218
-
219
-
220
-
221
-
222
-
223
-
224
-
225
-
226
-
227
-
228
-
229
-
230
-
231
-
232
-
233
-
234
-
235
-
236
-
237
-
238
-
239
-
240
-
241
-
242
-
243
-
244
-
245
-
246
-
247
-
248
-
249
-
250
-
251
-
252
-
253
-
254
-
255
-
256
-
257
-
258
-
259
-
260
-
261
-
262
-
263
-
264
-
265
-
266
-
267
-
268
-
269
-
270
-
271
-
272
-
273
-
274
-
275
-
276
-
277
-
278
-
279
-
280
-
281
-
282
-
283
-
284
-
285
-
286
-
287
-
288
-
289
-
290
-
291
-
292
-
293
-
294
-
295
-
296
-
297
-
298
-
299
-
300
-
301
-
302
-
303
-
304
-
305
-
306
-
307
-
308
-
309
-
310
-
311
 |
 |
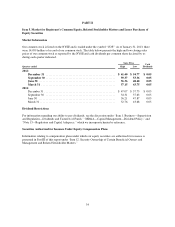
Item 6. Selected Financial Data
The following table presents selected consolidated financial data and performance metrics for the five-year
period ended December 31, 2012. Certain prior period amounts have been reclassified to conform to the current
period presentation. We prepare our consolidated financial statements based on generally accepted accounting
principles in the U.S. (“U.S. GAAP”), which we refer to as our reported results. This data should be reviewed in
conjunction with our audited consolidated financial statements and related notes and with the Management’s
Discussion and Analysis of Financial Condition and Results of Operations (“MD&A”) included in this Report.
The historical financial information presented may not be indicative of our future performance. The acquisitions
of ING Direct on February 17, 2012 and the 2012 U.S. card acquisition on May 1, 2012 had a significant impact
on our results and selected metrics for the year ended December 31, 2012 and our financial condition as of
December 31, 2012.
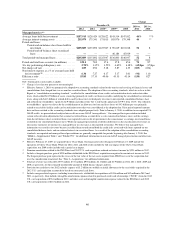
We use the term “acquired loans” to refer to a limited portion of the credit card loans acquired in the 2012 U.S.
card acquisition and the substantial majority of consumer and commercial loans acquired in the ING Direct and
Chevy Chase Bank (“CCB”) acquisitions, which were recorded at fair value at acquisition and subsequently
accounted for based on expected cash flows to be collected (under the accounting standard formerly known as
“Statement of Position 03-3, Accounting for Certain Loans or Debt Securities Acquired in a Transfer,”
commonly referred to as “SOP 03-3”). The loans acquired in the 2012 U.S. card acquisition accounted for based
on expected cash flows consisted of loans with a fair value at acquisition of approximately $651 million that
were deemed to be credit impaired because they were delinquent and revolving cardholder privileges had been
revoked. The difference between the fair value and initial expected cash flows represents the accretable yield,
which is recognized into interest income over the life of the loans. The difference between the contractual
payments on the loans and the expected cash flows represents the nonaccretable difference or the amount not
considered collectible, which approximates what we refer to as the “credit mark.” The credit mark established
under the accounting for these loans takes into consideration future expected credit losses over the life of the
loans. Accordingly, there are no charge-offs or an allowance associated with these loans unless the estimated
cash flows expected to be collected decrease subsequent to acquisition. In addition, these loans are not classified
as delinquent or nonperforming even though the customer may be contractually past due because we expect that
we will fully collect the carrying value of these loans. The accounting and classification of these loans may
significantly alter some of our reported credit quality metrics. We therefore supplement certain reported credit
quality metrics with metrics adjusted to exclude the impact of these acquired loans.
Of the $27.8 billion in outstanding receivables that we acquired in the 2012 U.S. card acquisition that were
designated as held for investment, $26.2 billion had existing revolving privileges at acquisition and were
therefore excluded from the acquired loan accounting guidance described above. These loans were recorded at
fair value of $26.9 billion at acquisition, which resulted in a net premium of $705 million that is being amortized
against interest income over the remaining life of the loans. In the second quarter of 2012, we recorded a
provision for credit losses of $1.2 billion, which is included in our total provision for credit losses of $4.4 billion
for 2012, to establish an initial allowance related to these loans. For additional information, see “Credit Risk
Profile” and “Note 5—Loans—Acquired Loans.”
37