Capital One 2012 Annual Report Download - page 136
Download and view the complete annual report
Please find page 136 of the 2012 Capital One annual report below. You can navigate through the pages in the report by either clicking on the pages listed below, or by using the keyword search tool below to find specific information within the annual report.-
 1
1 -
2
-
3
-
4
-
5
-
6
-
7
-
8
-
9
-
10
-
11
-
12
-
13
-
14
-
15
-
16
-
17
-
18
-
19
-
20
-
21
-
22
-
23
-
24
-
25
-
26
-
27
-
28
-
29
-
30
-
31
-
32
-
33
-
34
-
35
-
36
-
37
-
38
-
39
-
40
-
41
-
42
-
43
-
44
-
45
-
46
-
47
-
48
-
49
-
50
-
51
-
52
-
53
-
54
-
55
-
56
-
57
-
58
-
59
-
60
-
61
-
62
-
63
-
64
-
65
-
66
-
67
-
68
-
69
-
70
-
71
-
72
-
73
-
74
-
75
-
76
-
77
-
78
-
79
-
80
-
81
-
82
-
83
-
84
-
85
-
86
-
87
-
88
-
89
-
90
-
91
-
92
-
93
-
94
-
95
-
96
-
97
-
98
-
99
-
100
-
101
-
102
-
103
-
104
-
105
-
106
-
107
-
108
-
109
-
110
-
111
-
112
-
113
-
114
-
115
-
116
-
117
-
118
-
119
-
120
-
121
-
122
-
123
-
124
-
125
-
 126
126 -
 127
127 -
 128
128 -
 129
129 -
 130
130 -
 131
131 -
 132
132 -
 133
133 -
 134
134 -
 135
135 -
 136
136 -
 137
137 -
 138
138 -
 139
139 -
 140
140 -
 141
141 -
 142
142 -
 143
143 -
 144
144 -
 145
145 -
 146
146 -
147
-
148
-
149
-
150
-
151
-
152
-
153
-
154
-
155
-
156
-
157
-
158
-
159
-
160
-
161
-
162
-
163
-
164
-
165
-
166
-
167
-
168
-
169
-
170
-
171
-
172
-
173
-
174
-
175
-
176
-
177
-
178
-
179
-
180
-
181
-
182
-
183
-
184
-
185
-
186
-
187
-
188
-
189
-
190
-
191
-
192
-
193
-
194
-
195
-
196
-
197
-
198
-
199
-
200
-
201
-
202
-
203
-
204
-
205
-
206
-
207
-
208
-
209
-
210
-
211
-
212
-
213
-
214
-
215
-
216
-
217
-
218
-
219
-
220
-
221
-
222
-
223
-
224
-
225
-
226
-
227
-
228
-
229
-
230
-
231
-
232
-
233
-
234
-
235
-
236
-
237
-
238
-
239
-
240
-
241
-
242
-
243
-
244
-
245
-
246
-
247
-
248
-
249
-
250
-
251
-
252
-
253
-
254
-
255
-
256
-
257
-
258
-
259
-
260
-
261
-
262
-
263
-
264
-
265
-
266
-
267
-
268
-
269
-
270
-
271
-
272
-
273
-
274
-
275
-
276
-
277
-
278
-
279
-
280
-
281
-
282
-
283
-
284
-
285
-
286
-
287
-
288
-
289
-
290
-
291
-
292
-
293
-
294
-
295
-
296
-
297
-
298
-
299
-
300
-
301
-
302
-
303
-
304
-
305
-
306
-
307
-
308
-
309
-
310
-
311
 |
 |

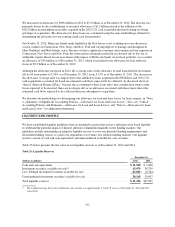
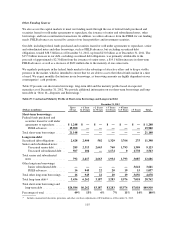
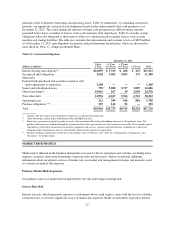
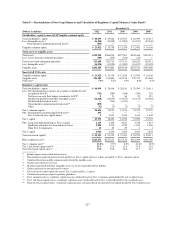
primarily relate to deposits, borrowings and operating leases. Table 31 summarizes, by remaining contractual
maturity, our significant contractual cash obligations based on the undiscounted future cash payments as of
December 31, 2012. The actual timing and amounts of future cash payments may differ from the amounts
presented below due to a number of factors, such as discretionary debt repurchases. Table 31 excludes certain
obligations where the obligation is short-term or subject to valuation based on market factors, such as trade
payables and trading liabilities. The table also excludes the representation and warranty reserve of $899 million
as of December 31, 2012 and obligations for pension and postretirement benefit plans, which are discussed in
more detail in “Note 17—Employee Benefit Plans.”
Table 31: Contractual Obligations
December 31, 2012
(Dollars in millions)
Up to
1 Year
> 1 Year
to 3 Years
> 3 Years
to 5 Years > 5 Years Total
Interest-bearing time deposits(1) ...................... $10,855 $ 3,765 $ 468 $ 435 $15,523
Securitized debt obligations ......................... 2,628 3,402 5,093 275 11,398
Other debt:
Federal funds purchased and securities loaned or sold
under agreements to repurchase ................... 1,248 — — — 1,248
Senior and subordinated notes ....................... 792 5,080 3,727 3,087 12,686
Other borrowings(2) ............................... 19,916 967 39 3,656 24,578
Total other debt ................................... 21,956 6,047 3,766 6,743 38,512
Operating leases .................................. 212 399 346 801 1,758
Purchase obligations(3)(4) ............................ 295 142 92 — 529
Total ........................................... $35,946 $13,755 $9,765 $8,254 $67,720
(1) Includes only those interest-bearing deposits which have a contractual maturity date.
(2) Other borrowings include junior subordinated debt and FHLB advances.
(3) Represents agreements to purchase goods or services that are enforceable and legally binding and specify all significant terms. The
purchase obligations are included through the termination date of the agreements even if the contract is renewable. These include capital
expenditures, contractual commitments to purchase equipment and services, software acquisition/license commitments, contractual
minimum media commitments and any contractually required cash payments for acquisitions.
(4) Excludes funding commitments entered into in the ordinary course of business. See “Note 21—Commitments, Contingencies and
Guarantees” for further details.
MARKET RISK PROFILE
Market risk is inherent in the financial instruments associated with our operations and activities, including loans,
deposits, securities, short-term borrowings, long-term debt and derivatives. Below we provide additional
information about our primary sources of market risk, our market risk management strategies and measures used
to evaluate our market risk exposure.
Primary Market Risk Exposures
Our primary sources of market risk include interest rate risk and foreign exchange risk.
Interest Rate Risk
Interest rate risk, which represents exposure to instruments whose yield or price varies with the level or volatility
of interest rates, is our most significant source of market risk exposure. Banks are inevitably exposed to interest
117