Capital One 2012 Annual Report Download - page 65
Download and view the complete annual report
Please find page 65 of the 2012 Capital One annual report below. You can navigate through the pages in the report by either clicking on the pages listed below, or by using the keyword search tool below to find specific information within the annual report.-
 1
1 -
2
-
3
-
4
-
5
-
6
-
7
-
8
-
9
-
10
-
11
-
12
-
13
-
14
-
15
-
16
-
17
-
18
-
19
-
20
-
21
-
22
-
23
-
24
-
25
-
26
-
27
-
28
-
29
-
30
-
31
-
32
-
33
-
34
-
35
-
36
-
37
-
38
-
39
-
40
-
41
-
42
-
43
-
44
-
45
-
46
-
47
-
48
-
49
-
50
-
51
-
52
-
53
-
54
-
 55
55 -
 56
56 -
 57
57 -
 58
58 -
 59
59 -
 60
60 -
 61
61 -
 62
62 -
 63
63 -
 64
64 -
 65
65 -
 66
66 -
 67
67 -
 68
68 -
 69
69 -
 70
70 -
 71
71 -
 72
72 -
 73
73 -
 74
74 -
 75
75 -
76
-
77
-
78
-
79
-
80
-
81
-
82
-
83
-
84
-
85
-
86
-
87
-
88
-
89
-
90
-
91
-
92
-
93
-
94
-
95
-
96
-
97
-
98
-
99
-
100
-
101
-
102
-
103
-
104
-
105
-
106
-
107
-
108
-
109
-
110
-
111
-
112
-
113
-
114
-
115
-
116
-
117
-
118
-
119
-
120
-
121
-
122
-
123
-
124
-
125
-
126
-
127
-
128
-
129
-
130
-
131
-
132
-
133
-
134
-
135
-
136
-
137
-
138
-
139
-
140
-
141
-
142
-
143
-
144
-
145
-
146
-
147
-
148
-
149
-
150
-
151
-
152
-
153
-
154
-
155
-
156
-
157
-
158
-
159
-
160
-
161
-
162
-
163
-
164
-
165
-
166
-
167
-
168
-
169
-
170
-
171
-
172
-
173
-
174
-
175
-
176
-
177
-
178
-
179
-
180
-
181
-
182
-
183
-
184
-
185
-
186
-
187
-
188
-
189
-
190
-
191
-
192
-
193
-
194
-
195
-
196
-
197
-
198
-
199
-
200
-
201
-
202
-
203
-
204
-
205
-
206
-
207
-
208
-
209
-
210
-
211
-
212
-
213
-
214
-
215
-
216
-
217
-
218
-
219
-
220
-
221
-
222
-
223
-
224
-
225
-
226
-
227
-
228
-
229
-
230
-
231
-
232
-
233
-
234
-
235
-
236
-
237
-
238
-
239
-
240
-
241
-
242
-
243
-
244
-
245
-
246
-
247
-
248
-
249
-
250
-
251
-
252
-
253
-
254
-
255
-
256
-
257
-
258
-
259
-
260
-
261
-
262
-
263
-
264
-
265
-
266
-
267
-
268
-
269
-
270
-
271
-
272
-
273
-
274
-
275
-
276
-
277
-
278
-
279
-
280
-
281
-
282
-
283
-
284
-
285
-
286
-
287
-
288
-
289
-
290
-
291
-
292
-
293
-
294
-
295
-
296
-
297
-
298
-
299
-
300
-
301
-
302
-
303
-
304
-
305
-
306
-
307
-
308
-
309
-
310
-
311
 |
 |
and Estimates—Representation and Warranty Reserve” and “Note 21—Commitments, Contingencies and
Guarantees.”
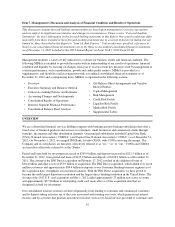
Business Segments
•Credit Card: Our Credit Card business generated net income from continuing operations of $1.5 billion in
2012, compared with net income from continuing operations of $2.3 billion in 2011. The decrease in
earnings in 2012 was largely due to significant post-acquisition charges related to the 2012 U.S. card
acquisition, including a provision for credit losses of $1.2 billion to establish an initial allowance for
outstanding credit card receivables from the 2012 U.S. card acquisition with existing revolving privileges at
acquisition, PCCR intangible amortization expense of $334 million and higher operating expenses resulting
from the 2012 U.S. card acquisition. The unfavorable impact of these charges diminished the favorable
impact of the substantial increase in total net revenue resulting from the addition of credit card receivables
from the 2012 U.S. card acquisition. Period-end loans in our Credit Card business increased by $26.7
billion, or 41%, in 2012, to $91.8 billion as of December 31, 2012. The increase was primarily due to the
addition of the $27.8 billion in outstanding receivables classified as held for investment. Excluding the
addition of the acquired receivables, period-end loans held for investment decreased by $1.1 billion, or 2%,
due to the expected continued run-off of our installment loan portfolio.
•Consumer Banking: Our Consumer Banking business generated net income from continuing operations of
$1.4 billion in 2012, compared with net income from continuing operations of $809 million in 2011. The
increase in earnings was attributable to growth in total net revenue, which was partially offset by higher
non-interest expense and an increase in the provision for credit losses. Growth in revenue stemmed from
higher average loan balances resulting from increased auto loan originations and added home loans from the
ING Direct acquisition, coupled with the significant increase in deposits from the ING Direct acquisition.
The increase in non-interest expense was largely due to operating expenses associated with ING Direct,
higher infrastructure expenditures related to our home loan business and growth in auto originations and
higher marketing expenditures in our retail banking operations. The increase in the provision for credit
losses was largely due to higher auto loan balances resulting from growth in auto loan originations. Period-
end loans in our Consumer Banking business increased by $38.8 billion, or 107%, in 2012 to $75.1 billion
as of December 31, 2012, primarily due to the acquisition of $40.4 billion of ING Direct home loans and
growth in auto loan originations. Excluding the addition of the acquired ING Direct loans, period-end loans
held for investment decreased by $1.6 billion, or 4%, due to the expected continued run-off of our acquired
home loan portfolios.
•Commercial Banking: Our Commercial Banking business generated net income from continuing operations
of $835 million in 2012, compared with net income from continuing operations of $595 million in 2011.
The improvement in results for Commercial Banking was attributable to an increase in revenues driven by
increased average loan balances as well as a decrease in the provision for credit losses due to improving
credit trends. These factors were partially offset by higher non-interest expense resulting from operating
costs associated with the increased volume of loan originations in our commercial real estate and
commercial and industrial businesses, increased infrastructure expenditures and the expansion into new
markets. Period-end loans increased by $4.5 billion, or 13%, in 2012 to $38.8 billion as of December 31,
2012. The increase was driven by stronger loan originations in the commercial and industrial and
commercial real estate businesses, which was partially offset by the run-off and sale of a portion of the
small-ticket commercial real estate loan portfolio.
46