Capital One 2012 Annual Report Download - page 58
Download and view the complete annual report
Please find page 58 of the 2012 Capital One annual report below. You can navigate through the pages in the report by either clicking on the pages listed below, or by using the keyword search tool below to find specific information within the annual report.-
 1
1 -
2
-
3
-
4
-
5
-
6
-
7
-
8
-
9
-
10
-
11
-
12
-
13
-
14
-
15
-
16
-
17
-
18
-
19
-
20
-
21
-
22
-
23
-
24
-
25
-
26
-
27
-
28
-
29
-
30
-
31
-
32
-
33
-
34
-
35
-
36
-
37
-
38
-
39
-
40
-
41
-
42
-
43
-
44
-
45
-
46
-
47
-
 48
48 -
 49
49 -
 50
50 -
 51
51 -
 52
52 -
 53
53 -
 54
54 -
 55
55 -
 56
56 -
 57
57 -
 58
58 -
 59
59 -
 60
60 -
 61
61 -
 62
62 -
 63
63 -
 64
64 -
 65
65 -
 66
66 -
 67
67 -
 68
68 -
69
-
70
-
71
-
72
-
73
-
74
-
75
-
76
-
77
-
78
-
79
-
80
-
81
-
82
-
83
-
84
-
85
-
86
-
87
-
88
-
89
-
90
-
91
-
92
-
93
-
94
-
95
-
96
-
97
-
98
-
99
-
100
-
101
-
102
-
103
-
104
-
105
-
106
-
107
-
108
-
109
-
110
-
111
-
112
-
113
-
114
-
115
-
116
-
117
-
118
-
119
-
120
-
121
-
122
-
123
-
124
-
125
-
126
-
127
-
128
-
129
-
130
-
131
-
132
-
133
-
134
-
135
-
136
-
137
-
138
-
139
-
140
-
141
-
142
-
143
-
144
-
145
-
146
-
147
-
148
-
149
-
150
-
151
-
152
-
153
-
154
-
155
-
156
-
157
-
158
-
159
-
160
-
161
-
162
-
163
-
164
-
165
-
166
-
167
-
168
-
169
-
170
-
171
-
172
-
173
-
174
-
175
-
176
-
177
-
178
-
179
-
180
-
181
-
182
-
183
-
184
-
185
-
186
-
187
-
188
-
189
-
190
-
191
-
192
-
193
-
194
-
195
-
196
-
197
-
198
-
199
-
200
-
201
-
202
-
203
-
204
-
205
-
206
-
207
-
208
-
209
-
210
-
211
-
212
-
213
-
214
-
215
-
216
-
217
-
218
-
219
-
220
-
221
-
222
-
223
-
224
-
225
-
226
-
227
-
228
-
229
-
230
-
231
-
232
-
233
-
234
-
235
-
236
-
237
-
238
-
239
-
240
-
241
-
242
-
243
-
244
-
245
-
246
-
247
-
248
-
249
-
250
-
251
-
252
-
253
-
254
-
255
-
256
-
257
-
258
-
259
-
260
-
261
-
262
-
263
-
264
-
265
-
266
-
267
-
268
-
269
-
270
-
271
-
272
-
273
-
274
-
275
-
276
-
277
-
278
-
279
-
280
-
281
-
282
-
283
-
284
-
285
-
286
-
287
-
288
-
289
-
290
-
291
-
292
-
293
-
294
-
295
-
296
-
297
-
298
-
299
-
300
-
301
-
302
-
303
-
304
-
305
-
306
-
307
-
308
-
309
-
310
-
311
 |
 |

Change
Year Ended December 31, 2012 vs.
2011
2011 vs.
20102012 2011 2010(1) 2009(2) 2008
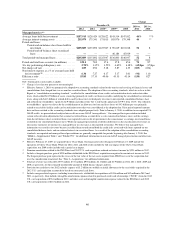
Selected performance metrics
Purchase volume(12) .......................... $180,599 $135,120 $106,912 $102,068 $113,835 34% 26%
Total net revenue margin(13) ................... 8.39% 9.28% 9.20% 8.94% 10.44% (89)bps 8bps
Net interest margin(14) ........................ 6.50 7.27 7.09 5.30 5.38 (77) 18
Net charge-offs ............................. $ 3,555 $ 3,771 $ 6,651 $ 4,568 $ 3,478 (6)% (43)%
Net charge-off rate(15) ........................ 1.89% 2.94% 5.18% 4.58% 3.51% (105)bps (224)bps
Net charge-off rate (excluding acquired
loans)(16) ................................. 2.34 3.06 5.45 4.94 3.51 (72) (239)
Return on average assets(17) .................... 1.30 1.63 1.52 0.58 0.05 (33) 11
Return on average stockholders’ equity(18) ........ 10.00 11.38 12.23 3.71 0.34 (138) (85)
Equity-to-assets ratio(19) ....................... 13.02 14.31 12.46 15.50 16.17 (129) 185
Non-interest expense as a % of average loans held
for investment(20) .......................... 6.36 7.27 6.17 7.43 8.30 (91) 110
Efficiency ratio(21) ........................... 55.83 57.33 49.06 56.21 52.29 (150) 827
Effective income tax rate ...................... 25.84 29.08 29.56 26.16 85.47 (324) (48)
Change
December 31, 2012 vs.
2011
2011 vs.
20102012 2011 2010(1) 2009(2) 2008
Balance sheet (period end)
Loans held for investment(11) ...................$205,889 $135,892 $125,947 $ 90,619 $101,018 52% 8%
Interest-earning assets ........................ 280,096 179,878 172,071 139,751 141,471 56 5
Total assets ................................. 312,918 206,019 197,503 169,646 165,913 52 4
Interest-bearing deposits ....................... 190,018 109,945 107,162 102,370 97,327 73 3
Total deposits ............................... 212,485 128,226 122,210 115,809 108,621 66 5
Borrowings ................................. 49,910 39,561 41,796 21,014 23,178 26 (5)
Stockholders’ equity .......................... 40,499 29,666 26,541 26,590 26,612 37 12
Credit quality metrics (period end)
Allowance for loan and lease losses ..............$ 5,156 $ 4,250 $ 5,628 $ 4,127 $ 4,524 21% (24)%
Allowance as a % of loans held for investment ..... 2.50% 3.13% 4.47% 4.55% 4.48% (63)bps (134)bps
Allowance as a % of loans held for investment
(excluding acquired loans) (16) ................ 3.02 3.22 4.67 4.95 4.48 (20) (145)
30+ day performing delinquency rate ............. 2.70 3.35 3.52 3.98 4.21 (65) (17)
30+ day performing delinquency rate (excluding
acquired loans) (16) ......................... 3.29 3.47 3.68 4.32 4.21 (18) (21)
30+ day delinquency rate ...................... 3.09 3.95 4.23 N/A N/A (86) (28)
30+ day delinquency rate (excluding acquired
loans) (16) ................................. 3.77 4.09 4.43 N/A N/A (32) (34)
Capital ratios
Tier 1 common ratio(22) ........................ 11.0% 9.7% 8.8% 10.6% 12.5% 130bps 90bps
Tier 1 risk-based capital ratio(23) ................ 11.3 12.0 11.6 13.8 13.8 (60) 40
Total risk-based capital ratio(24) ................. 13.6 14.9 16.8 17.7 16.7 (130) (190)
Tangible common equity ratio (“TCE” ratio”)(25) ... 7.9 8.2 6.9 8.0 9.2 (30) 130
Associates
Full-time equivalent employees (in thousands) ..... 39.6 30.5 25.7 25.9 23.7 30% 19%
39