Capital One 2012 Annual Report Download - page 248
Download and view the complete annual report
Please find page 248 of the 2012 Capital One annual report below. You can navigate through the pages in the report by either clicking on the pages listed below, or by using the keyword search tool below to find specific information within the annual report.-
 1
1 -
2
-
3
-
4
-
5
-
6
-
7
-
8
-
9
-
10
-
11
-
12
-
13
-
14
-
15
-
16
-
17
-
18
-
19
-
20
-
21
-
22
-
23
-
24
-
25
-
26
-
27
-
28
-
29
-
30
-
31
-
32
-
33
-
34
-
35
-
36
-
37
-
38
-
39
-
40
-
41
-
42
-
43
-
44
-
45
-
46
-
47
-
48
-
49
-
50
-
51
-
52
-
53
-
54
-
55
-
56
-
57
-
58
-
59
-
60
-
61
-
62
-
63
-
64
-
65
-
66
-
67
-
68
-
69
-
70
-
71
-
72
-
73
-
74
-
75
-
76
-
77
-
78
-
79
-
80
-
81
-
82
-
83
-
84
-
85
-
86
-
87
-
88
-
89
-
90
-
91
-
92
-
93
-
94
-
95
-
96
-
97
-
98
-
99
-
100
-
101
-
102
-
103
-
104
-
105
-
106
-
107
-
108
-
109
-
110
-
111
-
112
-
113
-
114
-
115
-
116
-
117
-
118
-
119
-
120
-
121
-
122
-
123
-
124
-
125
-
126
-
127
-
128
-
129
-
130
-
131
-
132
-
133
-
134
-
135
-
136
-
137
-
138
-
139
-
140
-
141
-
142
-
143
-
144
-
145
-
146
-
147
-
148
-
149
-
150
-
151
-
152
-
153
-
154
-
155
-
156
-
157
-
158
-
159
-
160
-
161
-
162
-
163
-
164
-
165
-
166
-
167
-
168
-
169
-
170
-
171
-
172
-
173
-
174
-
175
-
176
-
177
-
178
-
179
-
180
-
181
-
182
-
183
-
184
-
185
-
186
-
187
-
188
-
189
-
190
-
191
-
192
-
193
-
194
-
195
-
196
-
197
-
198
-
199
-
200
-
201
-
202
-
203
-
204
-
205
-
206
-
207
-
208
-
209
-
210
-
211
-
212
-
213
-
214
-
215
-
216
-
217
-
218
-
219
-
220
-
221
-
222
-
223
-
224
-
225
-
226
-
227
-
228
-
229
-
230
-
231
-
232
-
233
-
234
-
235
-
236
-
237
-
 238
238 -
 239
239 -
 240
240 -
 241
241 -
 242
242 -
 243
243 -
 244
244 -
 245
245 -
 246
246 -
 247
247 -
 248
248 -
 249
249 -
 250
250 -
 251
251 -
 252
252 -
 253
253 -
 254
254 -
 255
255 -
 256
256 -
 257
257 -
 258
258 -
259
-
260
-
261
-
262
-
263
-
264
-
265
-
266
-
267
-
268
-
269
-
270
-
271
-
272
-
273
-
274
-
275
-
276
-
277
-
278
-
279
-
280
-
281
-
282
-
283
-
284
-
285
-
286
-
287
-
288
-
289
-
290
-
291
-
292
-
293
-
294
-
295
-
296
-
297
-
298
-
299
-
300
-
301
-
302
-
303
-
304
-
305
-
306
-
307
-
308
-
309
-
310
-
311
 |
 |

CAPITAL ONE FINANCIAL CORPORATION
NOTES TO CONSOLIDATED FINANCIAL STATEMENTS—(Continued)
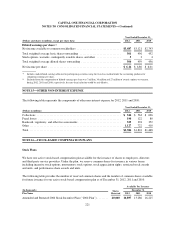
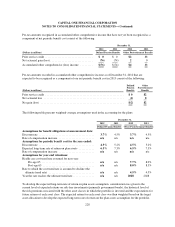
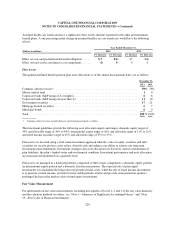
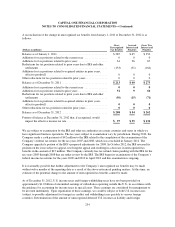
Assumed health care trend rates have a significant effect on the amounts reported for the other postretirement
benefit plans. A one-percentage point change in assumed health care cost trend rates would have the following
effects:
Year Ended December 31,
(Dollars in millions) 2012 2011
1% Increase 1% Decrease 1% Increase 1% Decrease
Effect on year-end postretirement benefit obligation ...... $ 7 $(6) $7 $(6)
Effect on total service and interest cost components ...... (1) 0 00
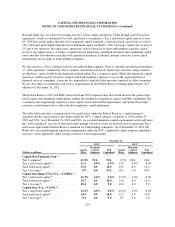
Plan Assets
The qualified defined benefit pension plan asset allocations as of the annual measurement dates are as follows:
December 31,
2012 2011
Common collective trusts(1) .......................................................... 59% 56%
Money market fund ................................................................ 10
Corporate bonds (S&P rating of A or higher) ............................................ 66
Corporate bonds (S&P rating of lower than A) .......................................... 11 10
Government securities .............................................................. 17 21
Mortgage backed securities .......................................................... 67
Municipal bonds .................................................................. 00
Total ........................................................................... 100 % 100%
(1) Common collective trusts include domestic and international equity securities.
The investment guidelines provide the following asset allocation targets and ranges: domestic equity target of
39% and allowable range of 34% to 44%, international equity target of 16% and allowable range of 11% to 21%,
and fixed income securities target of 45% and allowable range of 35% to 55%.
Plan assets are invested using a total return investment approach whereby a mix of equity securities and debt
securities are used to preserve asset values, diversify risk and enhance our ability to achieve our long-term
investment return benchmark. Investment strategies and asset allocations are based on careful consideration of
plan liabilities, the plan’s funded status and our financial condition. Investment performance and asset allocation
are measured and monitored on a quarterly basis.
Plan assets are managed in a balanced portfolio comprised of three major components: a domestic equity portion,
an international equity portion and a domestic fixed income portion. The expected role of plan equity
investments is to maximize the long-term real growth of fund assets, while the role of fixed income investments
is to generate current income, provide for more stable periodic returns and provide some protection against a
prolonged decline in the market value of fund equity investments.
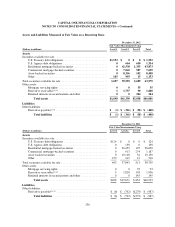
Fair Value Measurement
For information on fair value measurements, including descriptions of Level 1, 2 and 3 of the fair value hierarchy
and the valuation methods we utilize, see “Note 1—Summary of Significant Accounting Policies” and “Note
19—Fair Value of Financial Instruments.”
229