Capital One 2012 Annual Report Download - page 222
Download and view the complete annual report
Please find page 222 of the 2012 Capital One annual report below. You can navigate through the pages in the report by either clicking on the pages listed below, or by using the keyword search tool below to find specific information within the annual report.-
 1
1 -
2
-
3
-
4
-
5
-
6
-
7
-
8
-
9
-
10
-
11
-
12
-
13
-
14
-
15
-
16
-
17
-
18
-
19
-
20
-
21
-
22
-
23
-
24
-
25
-
26
-
27
-
28
-
29
-
30
-
31
-
32
-
33
-
34
-
35
-
36
-
37
-
38
-
39
-
40
-
41
-
42
-
43
-
44
-
45
-
46
-
47
-
48
-
49
-
50
-
51
-
52
-
53
-
54
-
55
-
56
-
57
-
58
-
59
-
60
-
61
-
62
-
63
-
64
-
65
-
66
-
67
-
68
-
69
-
70
-
71
-
72
-
73
-
74
-
75
-
76
-
77
-
78
-
79
-
80
-
81
-
82
-
83
-
84
-
85
-
86
-
87
-
88
-
89
-
90
-
91
-
92
-
93
-
94
-
95
-
96
-
97
-
98
-
99
-
100
-
101
-
102
-
103
-
104
-
105
-
106
-
107
-
108
-
109
-
110
-
111
-
112
-
113
-
114
-
115
-
116
-
117
-
118
-
119
-
120
-
121
-
122
-
123
-
124
-
125
-
126
-
127
-
128
-
129
-
130
-
131
-
132
-
133
-
134
-
135
-
136
-
137
-
138
-
139
-
140
-
141
-
142
-
143
-
144
-
145
-
146
-
147
-
148
-
149
-
150
-
151
-
152
-
153
-
154
-
155
-
156
-
157
-
158
-
159
-
160
-
161
-
162
-
163
-
164
-
165
-
166
-
167
-
168
-
169
-
170
-
171
-
172
-
173
-
174
-
175
-
176
-
177
-
178
-
179
-
180
-
181
-
182
-
183
-
184
-
185
-
186
-
187
-
188
-
189
-
190
-
191
-
192
-
193
-
194
-
195
-
196
-
197
-
198
-
199
-
200
-
201
-
202
-
203
-
204
-
205
-
206
-
207
-
208
-
209
-
210
-
211
-
 212
212 -
 213
213 -
 214
214 -
 215
215 -
 216
216 -
 217
217 -
 218
218 -
 219
219 -
 220
220 -
 221
221 -
 222
222 -
 223
223 -
 224
224 -
 225
225 -
 226
226 -
 227
227 -
 228
228 -
 229
229 -
 230
230 -
 231
231 -
 232
232 -
233
-
234
-
235
-
236
-
237
-
238
-
239
-
240
-
241
-
242
-
243
-
244
-
245
-
246
-
247
-
248
-
249
-
250
-
251
-
252
-
253
-
254
-
255
-
256
-
257
-
258
-
259
-
260
-
261
-
262
-
263
-
264
-
265
-
266
-
267
-
268
-
269
-
270
-
271
-
272
-
273
-
274
-
275
-
276
-
277
-
278
-
279
-
280
-
281
-
282
-
283
-
284
-
285
-
286
-
287
-
288
-
289
-
290
-
291
-
292
-
293
-
294
-
295
-
296
-
297
-
298
-
299
-
300
-
301
-
302
-
303
-
304
-
305
-
306
-
307
-
308
-
309
-
310
-
311
 |
 |

CAPITAL ONE FINANCIAL CORPORATION
NOTES TO CONSOLIDATED FINANCIAL STATEMENTS—(Continued)
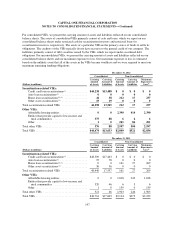
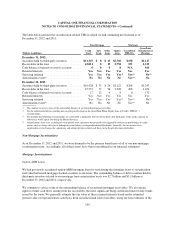
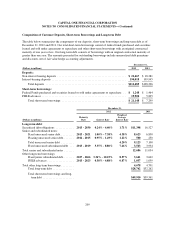
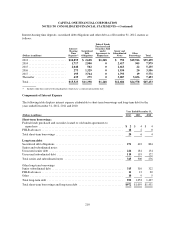
NOTE 8—GOODWILL AND OTHER INTANGIBLE ASSETS
The table below displays the components of goodwill and other intangible assets, as of December 31, 2012 and
2011:
December 31,
(Dollars in millions) 2012(1) 2011
Goodwill .................................................................. $13,904 $13,592
Other intangible assets:
Purchased credit card relationship intangibles ................................. 1,864 52
Core deposit intangibles .................................................. 496 479
Other ................................................................. 211 79
Total other intangible assets ................................................... 2,571 610
Total goodwill and other intangible assets ........................................ $16,475 $14,202
(1) December 31, 2012 amounts include goodwill and intangibles related to the 2012 U.S. card acquisition in the second quarter of 2012 and
intangibles related to the acquisition of ING Direct in the first quarter of 2012.
Goodwill
In accordance with applicable accounting guidance, goodwill is not amortized but is tested for impairment at the
reporting unit level, which is at the operating segment level or one level below an operating segment. Impairment
is the condition that exists when the carrying amount of goodwill exceeds its implied fair value. Goodwill is
required to be tested for impairment annually and between annual tests if events or circumstances change, such as
adverse changes in the business climate, that would more likely than not reduce the fair value of the reporting
unit below its carrying value. Goodwill is assigned to one or more reporting units at the date of acquisition. Our
reporting units are Domestic Credit Card, International Credit Card, Auto Finance, other Consumer
Banking and Commercial Banking. As of December 31, 2012 and 2011, goodwill of $13.9 billion and $13.6
billion, respectively, was included in the accompanying consolidated balance sheets. The goodwill impairment
test, performed at October 1 of each year, is a two-step test. The first step identifies whether there is potential
impairment by comparing the fair value of a reporting unit to the carrying amount, including goodwill. If the fair
value of a reporting unit is less than its carrying amount, the second step of the impairment test is required to
measure the amount of any impairment loss.
During the second quarter of 2012, we acquired the assets and assumed the liabilities of the credit card and
private label credit card business of HSBC. In connection with the acquisition, we recorded goodwill of $304
million representing the amount by which the purchase price exceeded the fair value of the net assets acquired.
The goodwill was assigned to the Credit Card segment. See “Note 2—Acquisitions” for information regarding
the 2012 U.S. card acquisition.
For the 2012 annual impairment test, the fair value of reporting units was calculated using a discounted cash flow
analysis, a form of the income approach, using each reporting unit’s internal forecast and a terminal value
calculated using a growth rate reflecting the nominal growth rate of the economy as a whole and appropriate
discount rates for the respective reporting units. Cash flows were adjusted, as necessary, in order to maintain
each reporting unit’s equity capital requirements. Our discounted cash flow analysis required management to
make judgments about future loan and deposit growth, revenue growth, credit losses, and capital rates. The cash
flows were discounted to present value using reporting unit specific discount rates that are largely based on our
203