Capital One 2012 Annual Report Download - page 226
Download and view the complete annual report
Please find page 226 of the 2012 Capital One annual report below. You can navigate through the pages in the report by either clicking on the pages listed below, or by using the keyword search tool below to find specific information within the annual report.-
 1
1 -
2
-
3
-
4
-
5
-
6
-
7
-
8
-
9
-
10
-
11
-
12
-
13
-
14
-
15
-
16
-
17
-
18
-
19
-
20
-
21
-
22
-
23
-
24
-
25
-
26
-
27
-
28
-
29
-
30
-
31
-
32
-
33
-
34
-
35
-
36
-
37
-
38
-
39
-
40
-
41
-
42
-
43
-
44
-
45
-
46
-
47
-
48
-
49
-
50
-
51
-
52
-
53
-
54
-
55
-
56
-
57
-
58
-
59
-
60
-
61
-
62
-
63
-
64
-
65
-
66
-
67
-
68
-
69
-
70
-
71
-
72
-
73
-
74
-
75
-
76
-
77
-
78
-
79
-
80
-
81
-
82
-
83
-
84
-
85
-
86
-
87
-
88
-
89
-
90
-
91
-
92
-
93
-
94
-
95
-
96
-
97
-
98
-
99
-
100
-
101
-
102
-
103
-
104
-
105
-
106
-
107
-
108
-
109
-
110
-
111
-
112
-
113
-
114
-
115
-
116
-
117
-
118
-
119
-
120
-
121
-
122
-
123
-
124
-
125
-
126
-
127
-
128
-
129
-
130
-
131
-
132
-
133
-
134
-
135
-
136
-
137
-
138
-
139
-
140
-
141
-
142
-
143
-
144
-
145
-
146
-
147
-
148
-
149
-
150
-
151
-
152
-
153
-
154
-
155
-
156
-
157
-
158
-
159
-
160
-
161
-
162
-
163
-
164
-
165
-
166
-
167
-
168
-
169
-
170
-
171
-
172
-
173
-
174
-
175
-
176
-
177
-
178
-
179
-
180
-
181
-
182
-
183
-
184
-
185
-
186
-
187
-
188
-
189
-
190
-
191
-
192
-
193
-
194
-
195
-
196
-
197
-
198
-
199
-
200
-
201
-
202
-
203
-
204
-
205
-
206
-
207
-
208
-
209
-
210
-
211
-
212
-
213
-
214
-
215
-
 216
216 -
 217
217 -
 218
218 -
 219
219 -
 220
220 -
 221
221 -
 222
222 -
 223
223 -
 224
224 -
 225
225 -
 226
226 -
 227
227 -
 228
228 -
 229
229 -
 230
230 -
 231
231 -
 232
232 -
 233
233 -
 234
234 -
 235
235 -
 236
236 -
237
-
238
-
239
-
240
-
241
-
242
-
243
-
244
-
245
-
246
-
247
-
248
-
249
-
250
-
251
-
252
-
253
-
254
-
255
-
256
-
257
-
258
-
259
-
260
-
261
-
262
-
263
-
264
-
265
-
266
-
267
-
268
-
269
-
270
-
271
-
272
-
273
-
274
-
275
-
276
-
277
-
278
-
279
-
280
-
281
-
282
-
283
-
284
-
285
-
286
-
287
-
288
-
289
-
290
-
291
-
292
-
293
-
294
-
295
-
296
-
297
-
298
-
299
-
300
-
301
-
302
-
303
-
304
-
305
-
306
-
307
-
308
-
309
-
310
-
311
 |
 |

CAPITAL ONE FINANCIAL CORPORATION
NOTES TO CONSOLIDATED FINANCIAL STATEMENTS—(Continued)
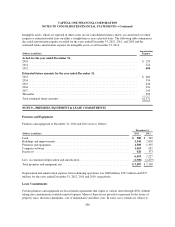
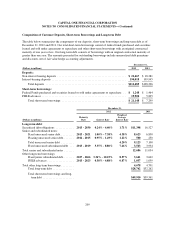
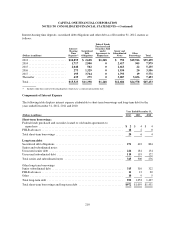
increases in relation to a cost of living index. Total rent expenses from continuing operations amounted to
approximately $216 million, $180 million and $191 million for the years ended December 31, 2012, 2011 and
2010, respectively.
Future minimum rental commitments as of December 31, 2012, for all non-cancelable operating leases with
initial or remaining terms of one year or more are as follows:
(Dollars in millions)
Estimated
Future
Minimum
Rental
Commitments
2013 ........................................................................... $ 212
2014 ........................................................................... 206
2015 ........................................................................... 193
2016 ........................................................................... 182
2017 ........................................................................... 164
Thereafter ...................................................................... 801
Total .......................................................................... $1,758
Minimum sublease rental income of $49 million due in future years under non-cancelable leases has not been
included in the table above as a reduction to minimum lease payments.
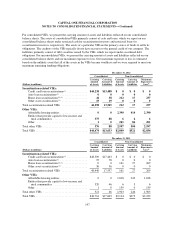
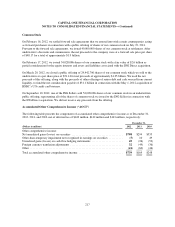
NOTE 10—DEPOSITS AND BORROWINGS
Customer Deposits
Our customer deposits, which are our largest source of funding for our operations and asset growth, consist of
non-interest bearing and interest-bearing deposits, including demand deposits, money market deposits, negotiable
order of withdrawal (“NOW”) accounts, savings accounts and certificates of deposit.
As of December 31, 2012, we had $190.0 billion in interest-bearing deposits, of which $4.5 billion represented
large denomination certificates of $100,000 or more. As of December 31, 2011, we had $109.9 billion in interest-
bearing deposits, of which $4.6 billion represents large denomination certificates of $100,000 or more. The year
over year increase of $80.1 billion reflects the addition of deposits from the ING Direct acquisition and increased
retail marketing efforts to attract new business and our continued strategy to leverage our bank outlets to attract
lower cost deposit funding.
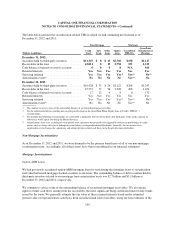
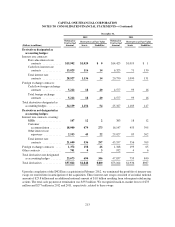
Securitized Debt Obligations
As of December 31, 2012, we had $11.4 billion of securitized debt obligations outstanding, including $22 million
in fair value hedging losses. As of December 31, 2011 we had $16.5 billion of securitized debt obligations
outstanding, including $27 million in fair value hedging losses. The $5.1 billion decrease was attributable to the
scheduled debt pay downs within our credit card securitization trusts. See “Note 11—Derivative Instruments and
Hedging Activities” for information about our fair value hedging activities.
207