Capital One 2012 Annual Report Download - page 120
Download and view the complete annual report
Please find page 120 of the 2012 Capital One annual report below. You can navigate through the pages in the report by either clicking on the pages listed below, or by using the keyword search tool below to find specific information within the annual report.-
 1
1 -
2
-
3
-
4
-
5
-
6
-
7
-
8
-
9
-
10
-
11
-
12
-
13
-
14
-
15
-
16
-
17
-
18
-
19
-
20
-
21
-
22
-
23
-
24
-
25
-
26
-
27
-
28
-
29
-
30
-
31
-
32
-
33
-
34
-
35
-
36
-
37
-
38
-
39
-
40
-
41
-
42
-
43
-
44
-
45
-
46
-
47
-
48
-
49
-
50
-
51
-
52
-
53
-
54
-
55
-
56
-
57
-
58
-
59
-
60
-
61
-
62
-
63
-
64
-
65
-
66
-
67
-
68
-
69
-
70
-
71
-
72
-
73
-
74
-
75
-
76
-
77
-
78
-
79
-
80
-
81
-
82
-
83
-
84
-
85
-
86
-
87
-
88
-
89
-
90
-
91
-
92
-
93
-
94
-
95
-
96
-
97
-
98
-
99
-
100
-
101
-
102
-
103
-
104
-
105
-
106
-
107
-
108
-
109
-
 110
110 -
 111
111 -
 112
112 -
 113
113 -
 114
114 -
 115
115 -
 116
116 -
 117
117 -
 118
118 -
 119
119 -
 120
120 -
 121
121 -
 122
122 -
 123
123 -
 124
124 -
 125
125 -
 126
126 -
 127
127 -
 128
128 -
 129
129 -
 130
130 -
131
-
132
-
133
-
134
-
135
-
136
-
137
-
138
-
139
-
140
-
141
-
142
-
143
-
144
-
145
-
146
-
147
-
148
-
149
-
150
-
151
-
152
-
153
-
154
-
155
-
156
-
157
-
158
-
159
-
160
-
161
-
162
-
163
-
164
-
165
-
166
-
167
-
168
-
169
-
170
-
171
-
172
-
173
-
174
-
175
-
176
-
177
-
178
-
179
-
180
-
181
-
182
-
183
-
184
-
185
-
186
-
187
-
188
-
189
-
190
-
191
-
192
-
193
-
194
-
195
-
196
-
197
-
198
-
199
-
200
-
201
-
202
-
203
-
204
-
205
-
206
-
207
-
208
-
209
-
210
-
211
-
212
-
213
-
214
-
215
-
216
-
217
-
218
-
219
-
220
-
221
-
222
-
223
-
224
-
225
-
226
-
227
-
228
-
229
-
230
-
231
-
232
-
233
-
234
-
235
-
236
-
237
-
238
-
239
-
240
-
241
-
242
-
243
-
244
-
245
-
246
-
247
-
248
-
249
-
250
-
251
-
252
-
253
-
254
-
255
-
256
-
257
-
258
-
259
-
260
-
261
-
262
-
263
-
264
-
265
-
266
-
267
-
268
-
269
-
270
-
271
-
272
-
273
-
274
-
275
-
276
-
277
-
278
-
279
-
280
-
281
-
282
-
283
-
284
-
285
-
286
-
287
-
288
-
289
-
290
-
291
-
292
-
293
-
294
-
295
-
296
-
297
-
298
-
299
-
300
-
301
-
302
-
303
-
304
-
305
-
306
-
307
-
308
-
309
-
310
-
311
 |
 |
delinquent for an extended period of time and other loans with significant risk of loss as nonperforming, the level
of nonperforming assets represents another indicator of the potential for future credit losses. In addition to
delinquency rates, the geographic distribution of our loans provides insight as to the credit quality of the portfolio
based on regional economic conditions.
We use borrower credit scores in underwriting for most consumer loans. We do not use credit scores as a primary
indicator of credit quality, because product differences, loan structure, and other factors drive large differences in
credit quality for a given credit score, and because a borrower’s credit score tends to be a lagging indicator of
credit quality. We continuously adjust our credit line management of credit lines and collection strategies based
on customer behavior and risk profile changes.
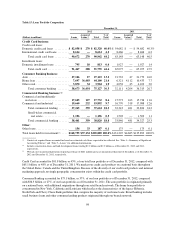
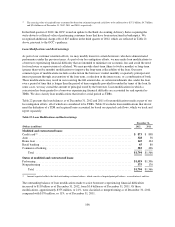
As noted above, our Credit Card business accounted for $91.8 billion, or 45%, of our total loan portfolio as of
December 31, 2012, with Domestic Card accounting for $83.1 billion, or 40%, of our total loan portfolio as of
December 31, 2012. Based on our most recent data, we estimate that approximately one-third of our Domestic
Card portfolio had credit scores less than 660 or no score, based on loan balances, as of December 31, 2012,
relatively consistent with the proportion of the Domestic Card portfolio with credit scores below 660 or no score
as of December 31, 2011. For loans related to the 2012 U.S. card acquisition and certain other partnerships, data
is obtained on a lagged basis.
We present information in the section below on the credit performance of our loan portfolio, including the key
metrics we use in tracking changes in the credit quality of our loan portfolio. Loans acquired as part of the CCB,
ING Direct and 2012 U.S. card acquisitions are included in the denominator used in calculating the credit quality
metrics presented below. Because some of these loans are accounted for based on expected cash flows to be
collected, which takes into consideration future credit losses expected to be incurred, there are no charge-offs or
an allowance associated with these loans unless the estimated cash flows expected to be collected decrease
subsequent to acquisition. In addition, these loans are not classified as delinquent or nonperforming even though
the customer may be contractually past due because we expect that we will fully collect the carrying value of
these loans. The accounting and classification of these loans may significantly alter some of our reported credit
quality metrics. We therefore supplement certain reported credit quality metrics with metrics adjusted to exclude
the impact of these acquired loans.
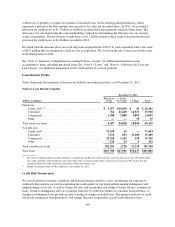
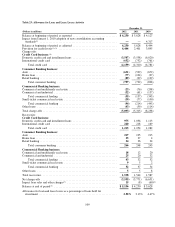
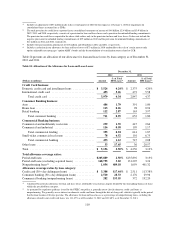
Delinquency Rates
We consider the entire balance of an account to be delinquent if the minimum required payment is not received
by the first statement cycle date equal to or following the due date specified on the customer’s billing statement.
Table 17 compares 30+ day performing and total 30+ day delinquency rates, by loan category, as of
December 31, 2012 and 2011. Table 17 also presents these metrics adjusted to exclude from the denominator
acquired loans accounted for based on estimated cash flows expected to be collected over the life of the loans.
Our 30+ day delinquency metrics include all held-for-investment loans that are 30 or more days past due,
whereas our 30+ day performing delinquency metrics include loans that are 30 or more days past due and that are
also currently classified as performing and accruing interest. The 30+ day delinquency and 30+ day performing
delinquency metrics are generally the same for credit card loans, as we continue to classify the substantial
majority of credit card loans as performing until the account is charged-off, typically when the account is
180 days past due. See “Note 1—Summary of Significant Accounting Policies—Loans” for information on our
policies for classifying loans as nonperforming for each of our loan categories.
101