Capital One 2012 Annual Report Download - page 258
Download and view the complete annual report
Please find page 258 of the 2012 Capital One annual report below. You can navigate through the pages in the report by either clicking on the pages listed below, or by using the keyword search tool below to find specific information within the annual report.-
 1
1 -
2
-
3
-
4
-
5
-
6
-
7
-
8
-
9
-
10
-
11
-
12
-
13
-
14
-
15
-
16
-
17
-
18
-
19
-
20
-
21
-
22
-
23
-
24
-
25
-
26
-
27
-
28
-
29
-
30
-
31
-
32
-
33
-
34
-
35
-
36
-
37
-
38
-
39
-
40
-
41
-
42
-
43
-
44
-
45
-
46
-
47
-
48
-
49
-
50
-
51
-
52
-
53
-
54
-
55
-
56
-
57
-
58
-
59
-
60
-
61
-
62
-
63
-
64
-
65
-
66
-
67
-
68
-
69
-
70
-
71
-
72
-
73
-
74
-
75
-
76
-
77
-
78
-
79
-
80
-
81
-
82
-
83
-
84
-
85
-
86
-
87
-
88
-
89
-
90
-
91
-
92
-
93
-
94
-
95
-
96
-
97
-
98
-
99
-
100
-
101
-
102
-
103
-
104
-
105
-
106
-
107
-
108
-
109
-
110
-
111
-
112
-
113
-
114
-
115
-
116
-
117
-
118
-
119
-
120
-
121
-
122
-
123
-
124
-
125
-
126
-
127
-
128
-
129
-
130
-
131
-
132
-
133
-
134
-
135
-
136
-
137
-
138
-
139
-
140
-
141
-
142
-
143
-
144
-
145
-
146
-
147
-
148
-
149
-
150
-
151
-
152
-
153
-
154
-
155
-
156
-
157
-
158
-
159
-
160
-
161
-
162
-
163
-
164
-
165
-
166
-
167
-
168
-
169
-
170
-
171
-
172
-
173
-
174
-
175
-
176
-
177
-
178
-
179
-
180
-
181
-
182
-
183
-
184
-
185
-
186
-
187
-
188
-
189
-
190
-
191
-
192
-
193
-
194
-
195
-
196
-
197
-
198
-
199
-
200
-
201
-
202
-
203
-
204
-
205
-
206
-
207
-
208
-
209
-
210
-
211
-
212
-
213
-
214
-
215
-
216
-
217
-
218
-
219
-
220
-
221
-
222
-
223
-
224
-
225
-
226
-
227
-
228
-
229
-
230
-
231
-
232
-
233
-
234
-
235
-
236
-
237
-
238
-
239
-
240
-
241
-
242
-
243
-
244
-
245
-
246
-
247
-
 248
248 -
 249
249 -
 250
250 -
 251
251 -
 252
252 -
 253
253 -
 254
254 -
 255
255 -
 256
256 -
 257
257 -
 258
258 -
 259
259 -
 260
260 -
 261
261 -
 262
262 -
 263
263 -
 264
264 -
 265
265 -
 266
266 -
 267
267 -
 268
268 -
269
-
270
-
271
-
272
-
273
-
274
-
275
-
276
-
277
-
278
-
279
-
280
-
281
-
282
-
283
-
284
-
285
-
286
-
287
-
288
-
289
-
290
-
291
-
292
-
293
-
294
-
295
-
296
-
297
-
298
-
299
-
300
-
301
-
302
-
303
-
304
-
305
-
306
-
307
-
308
-
309
-
310
-
311
 |
 |

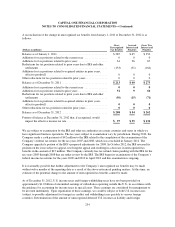
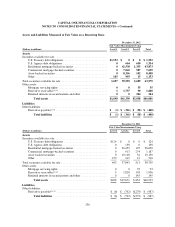
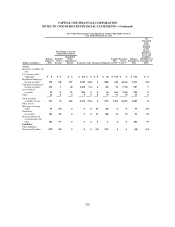
CAPITAL ONE FINANCIAL CORPORATION
NOTES TO CONSOLIDATED FINANCIAL STATEMENTS—(Continued)
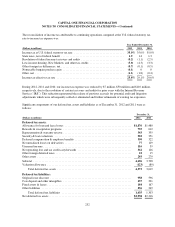
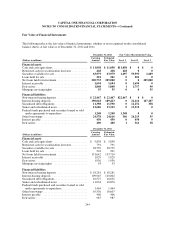
Fair Value Measurements Using Significant Unobservable Inputs (Level 3)
Year Ended December 31, 2011
Total Gains or (Losses)
(Realized/Unrealized)
Net
Unrealized
Gains
(Losses)
Included
in Net
Income
Related to
Assets and
Liabilities
Still Held as of
December 31,
2011(3)
(Dollars in millions)
Balance,
January 1,
2011
Included
in Net
Income(1)
Included in
Other
Comprehensive
Income Purchases Sales Issuances Settlements
Transfers
Into
Level 3(2)
Transfers
Out of
Level 3(2)
Balance,
December 31,
2011
Assets:
Securities available for
sale:
Residential mortgage-
backed securities .... $578 $ 0 $(21) $ 20 $(14) $ 0 $(102) $76 $(342) $195 $0
Commercial mortgage-
backed securities . . . . 0 0 10 357 (30) 0 0 76 (139) 274 0
Asset-backed
securities .......... 13 0 (4) 34 0 0 0 0 (11) 32 0
Other ............... 7 0 0 0 0 0 (1) 6 0 12 0
Total securities available
for sale ............ 598 0 (15) 411 (44) 0 (103) 158 (492) 513 0
Other Assets:
Mortgage servicing
rights ............. 141 (44) 0 0 0 9 (13) 0 0 93 (44)
Derivative
receivables ......... 46 49 0 0 0 47 (34) 0 (5) 103 49
Retained interest in
securitizations and
other .............. 152 (7) 0 0 0 0 0 0 0 145 (7)
Liabilities:
Other liabilities:
Derivative Payables .... (43) (75) 0 0 0 (182) 17 0 4 (279) (75)
(1) Gains (losses) related to Level 3 mortgage servicing rights are reported in other non-interest income, which is a component of non-
interest income. Gains (losses) related to Level 3 derivative receivables and derivative payables are reported in other non-interest income,
which is a component of non-interest income. Gains (losses) related to Level 3 retained interests in securitizations are reported in
servicing and securitizations income, which is a component of non-interest income.
(2) The transfers out of Level 3 for the years ended December 31, 2012 and 2011 was primarily driven by greater consistency among
multiple pricing sources. The transfers into Level 3 were primarily driven by less consistency among vendor pricing on individual
securities.
(3) The amount presented for unrealized gains (loss) for assets still held as of the reporting date primarily represents impairments for
available-for-sale securities, accretion on certain fixed maturity securities, and change in fair value of derivative instruments. The
impairments are reported in total other-than-temporary losses as a component of non-interest income.
Significant Level 3 Fair Value Asset and Liability Input Sensitivity
Changes in unobservable inputs may have a significant impact on fair value. Certain of these unobservable inputs
will (in isolation) have a directionally consistent impact on the fair value of the instrument for a given change in that
input. Alternatively, the fair value of the instrument may move in an opposite direction for a given change in
another input. In general, an increase in the discount rate, default rates, loss severity and credit spreads, in isolation,
would result in a decrease in the fair value measurement. In addition, an increase in default rates would generally be
accompanied by a decrease in recovery rates, slower prepayment rates and an increase in liquidity spreads.
239