Capital One 2012 Annual Report Download - page 89
Download and view the complete annual report
Please find page 89 of the 2012 Capital One annual report below. You can navigate through the pages in the report by either clicking on the pages listed below, or by using the keyword search tool below to find specific information within the annual report.-
 1
1 -
2
-
3
-
4
-
5
-
6
-
7
-
8
-
9
-
10
-
11
-
12
-
13
-
14
-
15
-
16
-
17
-
18
-
19
-
20
-
21
-
22
-
23
-
24
-
25
-
26
-
27
-
28
-
29
-
30
-
31
-
32
-
33
-
34
-
35
-
36
-
37
-
38
-
39
-
40
-
41
-
42
-
43
-
44
-
45
-
46
-
47
-
48
-
49
-
50
-
51
-
52
-
53
-
54
-
55
-
56
-
57
-
58
-
59
-
60
-
61
-
62
-
63
-
64
-
65
-
66
-
67
-
68
-
69
-
70
-
71
-
72
-
73
-
74
-
75
-
76
-
77
-
78
-
 79
79 -
 80
80 -
 81
81 -
 82
82 -
 83
83 -
 84
84 -
 85
85 -
 86
86 -
 87
87 -
 88
88 -
 89
89 -
 90
90 -
 91
91 -
 92
92 -
 93
93 -
 94
94 -
 95
95 -
 96
96 -
 97
97 -
 98
98 -
 99
99 -
100
-
101
-
102
-
103
-
104
-
105
-
106
-
107
-
108
-
109
-
110
-
111
-
112
-
113
-
114
-
115
-
116
-
117
-
118
-
119
-
120
-
121
-
122
-
123
-
124
-
125
-
126
-
127
-
128
-
129
-
130
-
131
-
132
-
133
-
134
-
135
-
136
-
137
-
138
-
139
-
140
-
141
-
142
-
143
-
144
-
145
-
146
-
147
-
148
-
149
-
150
-
151
-
152
-
153
-
154
-
155
-
156
-
157
-
158
-
159
-
160
-
161
-
162
-
163
-
164
-
165
-
166
-
167
-
168
-
169
-
170
-
171
-
172
-
173
-
174
-
175
-
176
-
177
-
178
-
179
-
180
-
181
-
182
-
183
-
184
-
185
-
186
-
187
-
188
-
189
-
190
-
191
-
192
-
193
-
194
-
195
-
196
-
197
-
198
-
199
-
200
-
201
-
202
-
203
-
204
-
205
-
206
-
207
-
208
-
209
-
210
-
211
-
212
-
213
-
214
-
215
-
216
-
217
-
218
-
219
-
220
-
221
-
222
-
223
-
224
-
225
-
226
-
227
-
228
-
229
-
230
-
231
-
232
-
233
-
234
-
235
-
236
-
237
-
238
-
239
-
240
-
241
-
242
-
243
-
244
-
245
-
246
-
247
-
248
-
249
-
250
-
251
-
252
-
253
-
254
-
255
-
256
-
257
-
258
-
259
-
260
-
261
-
262
-
263
-
264
-
265
-
266
-
267
-
268
-
269
-
270
-
271
-
272
-
273
-
274
-
275
-
276
-
277
-
278
-
279
-
280
-
281
-
282
-
283
-
284
-
285
-
286
-
287
-
288
-
289
-
290
-
291
-
292
-
293
-
294
-
295
-
296
-
297
-
298
-
299
-
300
-
301
-
302
-
303
-
304
-
305
-
306
-
307
-
308
-
309
-
310
-
311
 |
 |

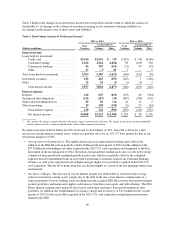
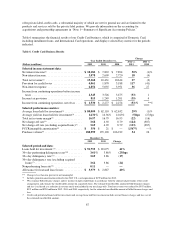
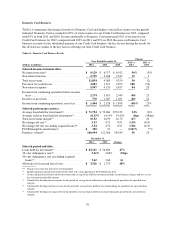
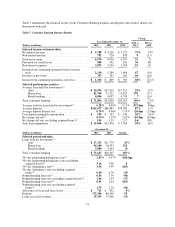
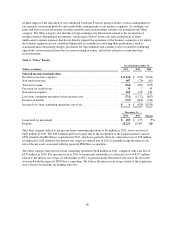
Domestic Card Business
Table 6.1 summarizes the financial results for Domestic Card and displays selected key metrics for the periods
indicated. Domestic Card accounted for 89% of total revenues for our Credit Card business in 2012, compared
with 87% in both 2011 and 2010. Income attributable to Domestic Card represented 92% of income for our
Credit Card business for 2012, compared with 102% in 2011 and 83% in 2010. Because our Domestic Card
business accounts for the substantial majority of our Credit Card business, the key factors driving the results for
this division are similar to the key factors affecting our total Credit Card business.
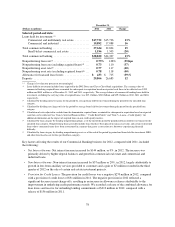
Table 6.1: Domestic Card Business Results
(Dollars in millions)
Year Ended December 31,
Change
2012 vs.
2011
2011 vs.
20102012 2011 2010
Selected income statement data:
Net interest income(1) ........................ $ 9,129 $ 6,717 $ 6,912 36% (3)%
Non-interest income .......................... 2,725 2,368 2,347 15 1
Total net revenue ............................ 11,854 9,085 9,259 30 (2)
Provision for credit losses ..................... 3,683 1,317 2,853 180 (54)
Non-interest expense ......................... 5,997 4,153 3,457 44 20
Income from continuing operations before income
taxes .................................... 2,174 3,615 2,949 (40) 23
Income tax provision ......................... 770 1,287 1,051 (40) 22
Income from continuing operations, net of tax ..... $ 1,404 $ 2,328 $ 1,898 (40)% 23%
Selected performance metrics:
Average loans held for investment(2) ............. $ 71,754 $ 53,464 $55,133 34% (3)%
Average yield on loans held for investment(3) ...... 14.15% 14.14% 14.42% 1bps (28)bps
Total net revenue margin(4) .................... 16.52 16.99 16.79 (47) 20
Net charge-off rate(5) ......................... 3.53 4.72 8.91 (119) (419)
Net charge-off rate (excluding acquired loans)(6) ... 3.54 4.72 8.91 (118) (419)
PCCR intangible amortization(7) ................ $ 350 21 — 1,567% **%
Purchase volume(8) ........................... 166,694 122,366 98,344 36 24
December 31,
2012 2011 Change
Selected period-end data:
Loans held for investment(2) ................... $ 83,141 $ 56,609 47%
30+ day delinquency rate(9) .................... 3.61% 3.66% (5)bps
30+ day delinquency rate (excluding acquired
loans)(6) .................................. 3.62 3.66 (4)
Allowance for loan and lease losses ............. $ 3,526 $ 2,375 48%
** Change is less than one percent or not meaningful.
(1) Includes premium amortization related to the 2012 U.S. card acquisition of $159 million for 2012.
(2) Credit card period-end loans held for investment and average loans held for investment include accrued finance charges and fees, net of
the estimated uncollectible amount.
(3) Calculated by dividing interest income for the period by average loans held for investment during the period for the specified loan
category.
(4) Calculated by dividing total net revenue for the period by average loans held for investment during the period for the specified loan
category.
(5) Calculated by dividing net charge-offs for the period by average loans held for investment during the period for the specified loan
category.
70