Capital One 2012 Annual Report Download - page 106
Download and view the complete annual report
Please find page 106 of the 2012 Capital One annual report below. You can navigate through the pages in the report by either clicking on the pages listed below, or by using the keyword search tool below to find specific information within the annual report.-
 1
1 -
2
-
3
-
4
-
5
-
6
-
7
-
8
-
9
-
10
-
11
-
12
-
13
-
14
-
15
-
16
-
17
-
18
-
19
-
20
-
21
-
22
-
23
-
24
-
25
-
26
-
27
-
28
-
29
-
30
-
31
-
32
-
33
-
34
-
35
-
36
-
37
-
38
-
39
-
40
-
41
-
42
-
43
-
44
-
45
-
46
-
47
-
48
-
49
-
50
-
51
-
52
-
53
-
54
-
55
-
56
-
57
-
58
-
59
-
60
-
61
-
62
-
63
-
64
-
65
-
66
-
67
-
68
-
69
-
70
-
71
-
72
-
73
-
74
-
75
-
76
-
77
-
78
-
79
-
80
-
81
-
82
-
83
-
84
-
85
-
86
-
87
-
88
-
89
-
90
-
91
-
92
-
93
-
94
-
95
-
 96
96 -
 97
97 -
 98
98 -
 99
99 -
 100
100 -
 101
101 -
 102
102 -
 103
103 -
 104
104 -
 105
105 -
 106
106 -
 107
107 -
 108
108 -
 109
109 -
 110
110 -
 111
111 -
 112
112 -
 113
113 -
 114
114 -
 115
115 -
 116
116 -
117
-
118
-
119
-
120
-
121
-
122
-
123
-
124
-
125
-
126
-
127
-
128
-
129
-
130
-
131
-
132
-
133
-
134
-
135
-
136
-
137
-
138
-
139
-
140
-
141
-
142
-
143
-
144
-
145
-
146
-
147
-
148
-
149
-
150
-
151
-
152
-
153
-
154
-
155
-
156
-
157
-
158
-
159
-
160
-
161
-
162
-
163
-
164
-
165
-
166
-
167
-
168
-
169
-
170
-
171
-
172
-
173
-
174
-
175
-
176
-
177
-
178
-
179
-
180
-
181
-
182
-
183
-
184
-
185
-
186
-
187
-
188
-
189
-
190
-
191
-
192
-
193
-
194
-
195
-
196
-
197
-
198
-
199
-
200
-
201
-
202
-
203
-
204
-
205
-
206
-
207
-
208
-
209
-
210
-
211
-
212
-
213
-
214
-
215
-
216
-
217
-
218
-
219
-
220
-
221
-
222
-
223
-
224
-
225
-
226
-
227
-
228
-
229
-
230
-
231
-
232
-
233
-
234
-
235
-
236
-
237
-
238
-
239
-
240
-
241
-
242
-
243
-
244
-
245
-
246
-
247
-
248
-
249
-
250
-
251
-
252
-
253
-
254
-
255
-
256
-
257
-
258
-
259
-
260
-
261
-
262
-
263
-
264
-
265
-
266
-
267
-
268
-
269
-
270
-
271
-
272
-
273
-
274
-
275
-
276
-
277
-
278
-
279
-
280
-
281
-
282
-
283
-
284
-
285
-
286
-
287
-
288
-
289
-
290
-
291
-
292
-
293
-
294
-
295
-
296
-
297
-
298
-
299
-
300
-
301
-
302
-
303
-
304
-
305
-
306
-
307
-
308
-
309
-
310
-
311
 |
 |

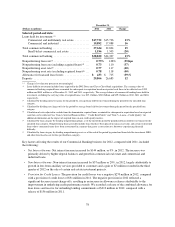
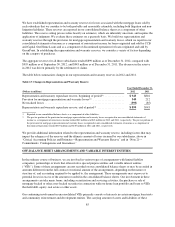
Table 14 provides a comparison of our capital ratios under the Federal Reserve’s capital adequacy standards and
the capital ratios of the Banks under the OCC’s capital adequacy standards as of December 31, 2012 and 2011.
Table 14: Capital Ratios Under Basel I(1)
December 31,
(Dollars in millions)
2012 2011
Capital
Ratio
Minimum
Capital
Adequacy
Well
Capitalized
Capital
Ratio
Minimum
Capital
Adequacy
Well
Capitalized
Capital One Financial Corp:(2)
Tier 1 common(3) ........................ 11.0% N/A N/A 9.7% N/A N/A
Tier 1 risk-based capital(4) ................. 11.3 4.0% 6.0% 12.0 4.0% 6.0%
Total risk-based capital(5) ................. 13.6 8.0 10.0 14.9 8.0 10.0
Tier 1 leverage(6) ........................ 8.7 4.0 N/A 10.1 4.0 N/A
Capital One Bank (USA) N.A. (“COBNA”):
Tier 1 risk-based capital(4) ................. 11.3% 4.0% 6.0% 11.2% 4.0% 6.0%
Total risk-based capital(5) ................. 14.7 8.0 10.0 15.0 8.0 10.0
Tier 1 leverage(6) ........................ 10.4 4.0 5.0 10.2 4.0 5.0
Capital One, N.A. (“CONA”):
Tier 1 risk-based capital(4) ................. 13.6% 4.0% 6.0% 11.0% 4.0% 6.0%
Total risk-based capital(5) ................. 14.9 8.0 10.0 12.2 8.0 10.0
Tier 1 leverage(6) ........................ 9.1 4.0 5.0 8.7 4.0 5.0
(1) Calculated under capital standards and regulations based on the international capital framework commonly known as Basel I. Capital
ratios that are not applicable are denoted by “N/A.”
(2) The regulatory framework for prompt corrective action does not apply to Capital One Financial Corp. because it is a bank holding
company.
(3) Tier 1 common ratio is a regulatory capital measure calculated based on Tier 1 common capital divided by risk-weighted assets.
(4) Tier 1 risk-based capital ratio is a regulatory capital measure calculated based on Tier 1 capital divided by risk-weighted assets.
(5) Total risk-based capital ratio is a regulatory capital measure calculated based on total risk-based capital divided by risk-weighted assets.
(6) Tier 1 leverage ratio is calculated based on Tier 1 capital divided by quarterly average total assets, after certain adjustments.
We exceeded minimum capital requirements and would meet the “well capitalized” ratio levels specified under
prompt corrective action for Tier 1 risk-based capital, total risk-based capital and Tier 1 leverage under Federal
Reserve capital standards for bank holding companies as of December 31, 2012. The Banks also exceeded
minimum regulatory requirements under the OCC’s applicable capital adequacy guidelines and were “well
capitalized” under prompt corrective action requirements as of December 31, 2012.
On October 17, 2012, the OCC approved, subject to several conditions, CONA’s application to merge with ING
Bank with CONA surviving the merger. In addition, the OCC approved CONA’s companion application to
reduce capital surplus, which was necessary to manage excess capital levels that would result from the merger.
CONA effected the reduction in surplus through a return of capital to Capital One immediately prior to the
merger. Capital One effected the merger on November 1, 2012. The merger and reduction in CONA’s capital
surplus had no effect on Capital One’s total capital.
Recent Developments in Capital and Liquidity Requirements
As of December 31, 2012, we had outstanding trust preferred securities with a combined aggregate principal
amount of $3.65 billion that previously qualified as Tier 1 capital. On January 2, 2013, we redeemed all of our
outstanding trust preferred securities, which generally carried a higher coupon cost, ranging from 3.36% to
10.25%, than other funding sources available to us. Pursuant to the Dodd-Frank Act, the Tier 1 capital treatment
of trust preferred securities is to be phased out over a three year period starting on January 1, 2013.
In June 2012, the Federal Reserve, OCC and FDIC released proposed rules that would increase the general risk-
based capital ratio minimum requirements, modify the definition of regulatory capital, establish a minimum Tier
87