Capital One 2012 Annual Report Download - page 275
Download and view the complete annual report
Please find page 275 of the 2012 Capital One annual report below. You can navigate through the pages in the report by either clicking on the pages listed below, or by using the keyword search tool below to find specific information within the annual report.-
 1
1 -
2
-
3
-
4
-
5
-
6
-
7
-
8
-
9
-
10
-
11
-
12
-
13
-
14
-
15
-
16
-
17
-
18
-
19
-
20
-
21
-
22
-
23
-
24
-
25
-
26
-
27
-
28
-
29
-
30
-
31
-
32
-
33
-
34
-
35
-
36
-
37
-
38
-
39
-
40
-
41
-
42
-
43
-
44
-
45
-
46
-
47
-
48
-
49
-
50
-
51
-
52
-
53
-
54
-
55
-
56
-
57
-
58
-
59
-
60
-
61
-
62
-
63
-
64
-
65
-
66
-
67
-
68
-
69
-
70
-
71
-
72
-
73
-
74
-
75
-
76
-
77
-
78
-
79
-
80
-
81
-
82
-
83
-
84
-
85
-
86
-
87
-
88
-
89
-
90
-
91
-
92
-
93
-
94
-
95
-
96
-
97
-
98
-
99
-
100
-
101
-
102
-
103
-
104
-
105
-
106
-
107
-
108
-
109
-
110
-
111
-
112
-
113
-
114
-
115
-
116
-
117
-
118
-
119
-
120
-
121
-
122
-
123
-
124
-
125
-
126
-
127
-
128
-
129
-
130
-
131
-
132
-
133
-
134
-
135
-
136
-
137
-
138
-
139
-
140
-
141
-
142
-
143
-
144
-
145
-
146
-
147
-
148
-
149
-
150
-
151
-
152
-
153
-
154
-
155
-
156
-
157
-
158
-
159
-
160
-
161
-
162
-
163
-
164
-
165
-
166
-
167
-
168
-
169
-
170
-
171
-
172
-
173
-
174
-
175
-
176
-
177
-
178
-
179
-
180
-
181
-
182
-
183
-
184
-
185
-
186
-
187
-
188
-
189
-
190
-
191
-
192
-
193
-
194
-
195
-
196
-
197
-
198
-
199
-
200
-
201
-
202
-
203
-
204
-
205
-
206
-
207
-
208
-
209
-
210
-
211
-
212
-
213
-
214
-
215
-
216
-
217
-
218
-
219
-
220
-
221
-
222
-
223
-
224
-
225
-
226
-
227
-
228
-
229
-
230
-
231
-
232
-
233
-
234
-
235
-
236
-
237
-
238
-
239
-
240
-
241
-
242
-
243
-
244
-
245
-
246
-
247
-
248
-
249
-
250
-
251
-
252
-
253
-
254
-
255
-
256
-
257
-
258
-
259
-
260
-
261
-
262
-
263
-
264
-
 265
265 -
 266
266 -
 267
267 -
 268
268 -
 269
269 -
 270
270 -
 271
271 -
 272
272 -
 273
273 -
 274
274 -
 275
275 -
 276
276 -
 277
277 -
 278
278 -
 279
279 -
 280
280 -
 281
281 -
 282
282 -
 283
283 -
 284
284 -
 285
285 -
286
-
287
-
288
-
289
-
290
-
291
-
292
-
293
-
294
-
295
-
296
-
297
-
298
-
299
-
300
-
301
-
302
-
303
-
304
-
305
-
306
-
307
-
308
-
309
-
310
-
311
 |
 |

CAPITAL ONE FINANCIAL CORPORATION
NOTES TO CONSOLIDATED FINANCIAL STATEMENTS—(Continued)
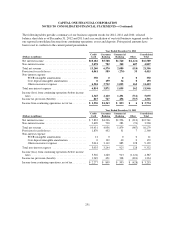
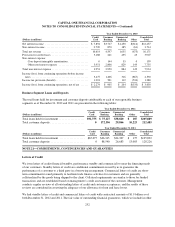
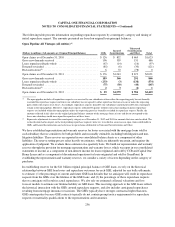
The following table presents information on pending repurchase requests by counterparty category and timing of
initial repurchase request. The amounts presented are based on original loan principal balances.
Open Pipeline All Vintages (all entities)(1)
(Dollars in millions) (All amounts are Original Principal Balance) GSEs
Insured
Securitizations
Uninsured
Securitizations
and Other Total
Open claims as of December 31, 2010 ........................ $126 $ 832 $665 $1,623
Gross new demands received ............................... 196 359 131 686
Loans repurchased/made whole ............................. (67) (14) (16) (97)
Demands rescinded ....................................... (85) (6) (30) (121)
Reclassifications(2) ........................................ 6 72 (78) 0
Open claims as of December 31, 2011 ........................ $176 $1,243 $ 672 $2,091
Gross new demands received ............................... 189 366 291 846
Loans repurchased/made whole ............................. (233) (3) (138) (374)
Demands rescinded ....................................... (75) (30) (40) (145)
Reclassifications(2) ........................................ 2 3 (4) 1
Open claims as of December 31, 2012 ........................ $ 59 $1,579 $ 781 $2,419
(1) The open pipeline includes all repurchase requests ever received by our subsidiaries where either the requesting party has not formally
rescinded the repurchase request and where our subsidiary has not agreed to either repurchase the loan at issue or make the requesting
party whole with respect to its losses. Accordingly, repurchase requests denied by our subsidiaries and not pursued by the counterparty
remain in the open pipeline. Moreover, repurchase requests submitted by parties without contractual standing to pursue repurchase
requests are included within the open pipeline unless the requesting party has formally rescinded its repurchase request. Finally, the
amounts reflected in this chart are the original principal balance amounts of the mortgage loans at issue and do not correspond to the
losses our subsidiary would incur upon the repurchase of these loans.
(2) Represents adjustments to correct the counterparty category as of December 31, 2012 and 2011 for amounts that were misclassified. The
reclassification had no impact on the total pending repurchase requests; however, it resulted in an increase in open claims attributable to
GSEs and Insured Securitizations and a decrease in open claims attributable to Uninsured Securitizations and Other.
We have established representation and warranty reserves for losses associated with the mortgage loans sold by
each subsidiary that we consider to be both probable and reasonably estimable, including both litigation and non-
litigation liabilities. These reserves are reported in our consolidated balance sheets as a component of other
liabilities. The reserve setting process relies heavily on estimates, which are inherently uncertain, and requires the
application of judgment. We evaluate these estimates on a quarterly basis. We build our representation and warranty
reserves through the provision for mortgage representation and warranty losses, which we report in our consolidated
statements of income as a component of non-interest income for loans originated and sold by CCB and Capital One
Home Loans and as a component of discontinued operations for loans originated and sold by GreenPoint. In
establishing the representation and warranty reserves, we consider a variety of factors depending on the category of
purchaser.
In establishing reserves for the $11 billion original principal balance of GSE loans, we rely on the historical
relationship between GSE loan losses and repurchase outcomes for each GSE, adjusted for any bulk settlements,
to estimate: (1) the percentage of current and future GSE loan defaults that we anticipate will result in repurchase
requests from the GSEs over the lifetime of the GSE loans; and (2) the percentage of those repurchase requests
that we anticipate will result in actual repurchases. We also rely on estimated collateral valuations and loss
forecast models to estimate our lifetime liability on GSE loans. This reserving approach to the GSE loans reflects
the historical interaction with the GSEs around repurchase requests, and also includes anticipated repurchases
resulting from mortgage insurance rescissions. The GSEs typically have stronger contractual rights than non-
GSE counterparties because GSE contracts typically do not contain prompt notice requirements for repurchase
requests or materiality qualifications to the representations and warranties.
256