Capital One 2012 Annual Report Download - page 260
Download and view the complete annual report
Please find page 260 of the 2012 Capital One annual report below. You can navigate through the pages in the report by either clicking on the pages listed below, or by using the keyword search tool below to find specific information within the annual report.-
 1
1 -
2
-
3
-
4
-
5
-
6
-
7
-
8
-
9
-
10
-
11
-
12
-
13
-
14
-
15
-
16
-
17
-
18
-
19
-
20
-
21
-
22
-
23
-
24
-
25
-
26
-
27
-
28
-
29
-
30
-
31
-
32
-
33
-
34
-
35
-
36
-
37
-
38
-
39
-
40
-
41
-
42
-
43
-
44
-
45
-
46
-
47
-
48
-
49
-
50
-
51
-
52
-
53
-
54
-
55
-
56
-
57
-
58
-
59
-
60
-
61
-
62
-
63
-
64
-
65
-
66
-
67
-
68
-
69
-
70
-
71
-
72
-
73
-
74
-
75
-
76
-
77
-
78
-
79
-
80
-
81
-
82
-
83
-
84
-
85
-
86
-
87
-
88
-
89
-
90
-
91
-
92
-
93
-
94
-
95
-
96
-
97
-
98
-
99
-
100
-
101
-
102
-
103
-
104
-
105
-
106
-
107
-
108
-
109
-
110
-
111
-
112
-
113
-
114
-
115
-
116
-
117
-
118
-
119
-
120
-
121
-
122
-
123
-
124
-
125
-
126
-
127
-
128
-
129
-
130
-
131
-
132
-
133
-
134
-
135
-
136
-
137
-
138
-
139
-
140
-
141
-
142
-
143
-
144
-
145
-
146
-
147
-
148
-
149
-
150
-
151
-
152
-
153
-
154
-
155
-
156
-
157
-
158
-
159
-
160
-
161
-
162
-
163
-
164
-
165
-
166
-
167
-
168
-
169
-
170
-
171
-
172
-
173
-
174
-
175
-
176
-
177
-
178
-
179
-
180
-
181
-
182
-
183
-
184
-
185
-
186
-
187
-
188
-
189
-
190
-
191
-
192
-
193
-
194
-
195
-
196
-
197
-
198
-
199
-
200
-
201
-
202
-
203
-
204
-
205
-
206
-
207
-
208
-
209
-
210
-
211
-
212
-
213
-
214
-
215
-
216
-
217
-
218
-
219
-
220
-
221
-
222
-
223
-
224
-
225
-
226
-
227
-
228
-
229
-
230
-
231
-
232
-
233
-
234
-
235
-
236
-
237
-
238
-
239
-
240
-
241
-
242
-
243
-
244
-
245
-
246
-
247
-
248
-
249
-
 250
250 -
 251
251 -
 252
252 -
 253
253 -
 254
254 -
 255
255 -
 256
256 -
 257
257 -
 258
258 -
 259
259 -
 260
260 -
 261
261 -
 262
262 -
 263
263 -
 264
264 -
 265
265 -
 266
266 -
 267
267 -
 268
268 -
 269
269 -
 270
270 -
271
-
272
-
273
-
274
-
275
-
276
-
277
-
278
-
279
-
280
-
281
-
282
-
283
-
284
-
285
-
286
-
287
-
288
-
289
-
290
-
291
-
292
-
293
-
294
-
295
-
296
-
297
-
298
-
299
-
300
-
301
-
302
-
303
-
304
-
305
-
306
-
307
-
308
-
309
-
310
-
311
 |
 |

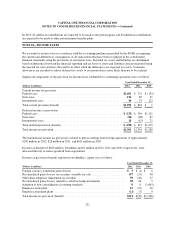
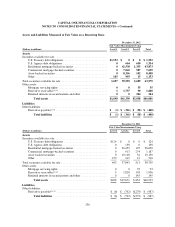
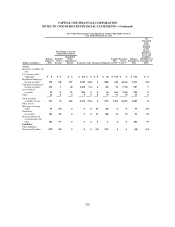
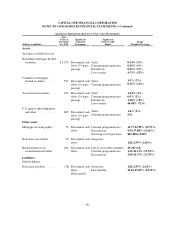
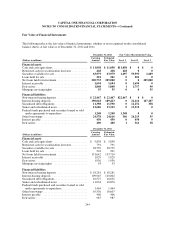
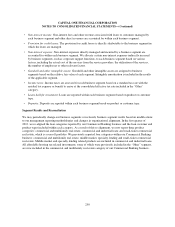
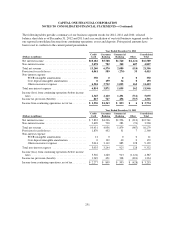
CAPITAL ONE FINANCIAL CORPORATION
NOTES TO CONSOLIDATED FINANCIAL STATEMENTS—(Continued)
Quantitative Information about Level 3 Fair Value Measurements
(Dollars in millions)
Fair
Value at
December
31, 2012
Significant
Valuation
Techniques
Significant
Unobservable
Inputs
Range
(Weighted Average)
Assets:
Securities available for sale:
Residential mortgage-backed
securities .............. $1,335 Discounted cash
flows (3rd party
pricing)
Yield
Constant prepayment rate
Default rate
Loss severity
0-24% (5%)
0-26% (6%)
0-21% (9%)
4-75% (52%)
Commercial mortgage-
backed securities ........ 587 Discounted cash
flows (3rd party
pricing)
Yield
Constant prepayment rate
1-3% (2%)
0-15% (11%)
Asset-backed securities ..... 102 Discounted cash
flows (3rd party
pricing)
Yield
Constant prepayment rate
Default rate
Loss severity
1-24% (4%)
0-5% (2%)
1-28% (15%)
46-88% (72%)
U.S. agency debt obligations
and other .............. 665 Discounted cash
flows (3rd party
pricing)
Yield
Constant prepayment rate
1-4% (2%)
N/A
Other assets:
Mortgage servicing rights . . . 55 Discounted cash
flows
Constant prepayment rate
Discount rate
Servicing cost ($ per loan)
11.77-32.99% (19.37%)
9.95-37.88% (12.66%)
$81-$864 ($302)
Derivative receivables ...... 90 Discounted cash
flows
Swap rates
1.82-2.59% (2.46%)
Retained interests in
securitization and other . . .
204 Discounted cash
flows
Life of receivables (months)
Constant prepayment rate
Discount rate
29-243 (66)
1.25-22.21% (13.52%)
2.90-13.57% (12.70%)
Liabilities:
Other liabilities:
Derivative payables ........ (38) Discounted cash
flows
Black model
Swap rates
Flat volatility
1.82-2.55% (2.42%)
24.66-25.03% (24.72%)
241