Capital One 2012 Annual Report Download - page 73
Download and view the complete annual report
Please find page 73 of the 2012 Capital One annual report below. You can navigate through the pages in the report by either clicking on the pages listed below, or by using the keyword search tool below to find specific information within the annual report.We provide additional information on the nature of and accounting for goodwill and other intangible assets,
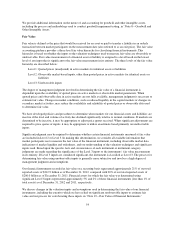
including the process and methodology used to conduct goodwill impairment testing, in “Note 8—Goodwill and
Other Intangible Assets.”
Fair Value
Fair value is defined as the price that would be received for an asset or paid to transfer a liability in an orderly
transaction between market participants on the measurement date (also referred to as an exit price). The fair value
accounting guidance provides a three-level fair value hierarchy for classifying financial instruments. This
hierarchy is based on whether the inputs to the valuation techniques used to measure fair value are observable or
unobservable. Fair value measurement of a financial asset or liability is assigned to a level based on the lowest
level of any input that is significant to the fair value measurement in its entirety. The three levels of the fair value
hierarchy are described below:
Level 1: Quoted prices (unadjusted) in active markets for identical assets or liabilities
Level 2: Observable market-based inputs, other than quoted prices in active markets for identical assets or
liabilities
Level 3: Unobservable inputs
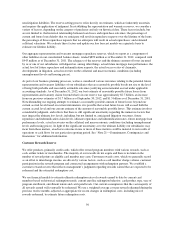
The degree of management judgment involved in determining the fair value of a financial instrument is
dependent upon the availability of quoted prices in active markets or observable market parameters. When
quoted prices and observable data in active markets are not fully available, management judgment is necessary to
estimate fair value. Changes in market conditions, such as reduced liquidity in the capital markets or changes in
secondary market activities, may reduce the availability and reliability of quoted prices or observable data used
to determine fair value.
We have developed policies and procedures to determine when markets for our financial assets and liabilities are
inactive if the level and volume of activity has declined significantly relative to normal conditions. If markets are
determined to be inactive, it may be appropriate to adjust price quotes received. When significant adjustments are
required to price quotes or inputs, it may be appropriate to utilize an estimate based primarily on unobservable
inputs.
Significant judgment may be required to determine whether certain financial instruments measured at fair value
are included in Level 2 or Level 3. In making this determination, we consider all available information that
market participants use to measure the fair value of the financial instrument, including observable market data,
indications of market liquidity and orderliness, and our understanding of the valuation techniques and significant
inputs used. Based upon the specific facts and circumstances of each instrument or instrument category,
judgments are made regarding the significance of the Level 3 inputs to the instruments’ fair value measurement
in its entirety. If Level 3 inputs are considered significant, the instrument is classified as Level 3. The process for
determining fair value using unobservable inputs is generally more subjective and involves a high degree of
management judgment and assumptions.
Our financial instruments recorded at fair value on a recurring basis represented approximately 21% of our total
reported assets of $312.9 billion as of December 31, 2012, compared with 20% of our total reported assets of
$206.0 billion as of December 31, 2011. Financial assets for which the fair value was determined using
significant Level 3 inputs represented approximately 5% and 2% of these financial instruments (less than 1% of
total assets) as of December 31, 2012 and 2011, respectively.
We discuss changes in the valuation inputs and assumptions used in determining the fair value of our financial
instruments, including the extent to which we have relied on significant unobservable inputs to estimate fair
value and our process for corroborating these inputs, in “Note 19—Fair Value of Financial Instruments.”
54


