Capital One 2012 Annual Report Download - page 80
Download and view the complete annual report
Please find page 80 of the 2012 Capital One annual report below. You can navigate through the pages in the report by either clicking on the pages listed below, or by using the keyword search tool below to find specific information within the annual report.-
 1
1 -
2
-
3
-
4
-
5
-
6
-
7
-
8
-
9
-
10
-
11
-
12
-
13
-
14
-
15
-
16
-
17
-
18
-
19
-
20
-
21
-
22
-
23
-
24
-
25
-
26
-
27
-
28
-
29
-
30
-
31
-
32
-
33
-
34
-
35
-
36
-
37
-
38
-
39
-
40
-
41
-
42
-
43
-
44
-
45
-
46
-
47
-
48
-
49
-
50
-
51
-
52
-
53
-
54
-
55
-
56
-
57
-
58
-
59
-
60
-
61
-
62
-
63
-
64
-
65
-
66
-
67
-
68
-
69
-
 70
70 -
 71
71 -
 72
72 -
 73
73 -
 74
74 -
 75
75 -
 76
76 -
 77
77 -
 78
78 -
 79
79 -
 80
80 -
 81
81 -
 82
82 -
 83
83 -
 84
84 -
 85
85 -
 86
86 -
 87
87 -
 88
88 -
 89
89 -
 90
90 -
91
-
92
-
93
-
94
-
95
-
96
-
97
-
98
-
99
-
100
-
101
-
102
-
103
-
104
-
105
-
106
-
107
-
108
-
109
-
110
-
111
-
112
-
113
-
114
-
115
-
116
-
117
-
118
-
119
-
120
-
121
-
122
-
123
-
124
-
125
-
126
-
127
-
128
-
129
-
130
-
131
-
132
-
133
-
134
-
135
-
136
-
137
-
138
-
139
-
140
-
141
-
142
-
143
-
144
-
145
-
146
-
147
-
148
-
149
-
150
-
151
-
152
-
153
-
154
-
155
-
156
-
157
-
158
-
159
-
160
-
161
-
162
-
163
-
164
-
165
-
166
-
167
-
168
-
169
-
170
-
171
-
172
-
173
-
174
-
175
-
176
-
177
-
178
-
179
-
180
-
181
-
182
-
183
-
184
-
185
-
186
-
187
-
188
-
189
-
190
-
191
-
192
-
193
-
194
-
195
-
196
-
197
-
198
-
199
-
200
-
201
-
202
-
203
-
204
-
205
-
206
-
207
-
208
-
209
-
210
-
211
-
212
-
213
-
214
-
215
-
216
-
217
-
218
-
219
-
220
-
221
-
222
-
223
-
224
-
225
-
226
-
227
-
228
-
229
-
230
-
231
-
232
-
233
-
234
-
235
-
236
-
237
-
238
-
239
-
240
-
241
-
242
-
243
-
244
-
245
-
246
-
247
-
248
-
249
-
250
-
251
-
252
-
253
-
254
-
255
-
256
-
257
-
258
-
259
-
260
-
261
-
262
-
263
-
264
-
265
-
266
-
267
-
268
-
269
-
270
-
271
-
272
-
273
-
274
-
275
-
276
-
277
-
278
-
279
-
280
-
281
-
282
-
283
-
284
-
285
-
286
-
287
-
288
-
289
-
290
-
291
-
292
-
293
-
294
-
295
-
296
-
297
-
298
-
299
-
300
-
301
-
302
-
303
-
304
-
305
-
306
-
307
-
308
-
309
-
310
-
311
 |
 |
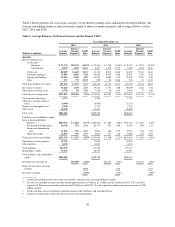
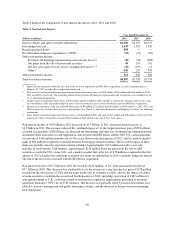
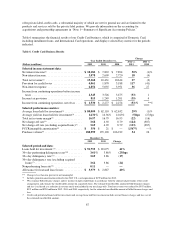
Direct and 2012 U.S. card acquisitions of $391 million in 2012 contributed to the reduction in the average
yield on interest-earning assets. The decrease in the average yield on interest-earnings assets was partially
offset by a reduction in our cost of funds. We have continued to benefit from the shift in the mix of our
funding to lower cost consumer and commercial banking deposits from higher cost wholesale sources and a
decline in deposit interest rates as a result of the continued overall low interest rate environment.
Net interest income of $12.7 billion for 2011 increased by $284 million, or 2%, from 2010, driven by a 3%
(18 basis points) expansion in our net interest margin to 7.27%, which was partially offset by a modest decrease
in average interest-earning assets.
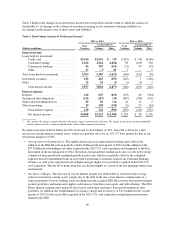
•Average Interest-Earning Assets: The decrease in average interest-earning assets in 2011 reflected the
continued run-off of businesses that we exited or repositioned, including our installment, home loan and
small-ticket commercial real estate loan portfolios, which was slightly offset by the impact of modest
revolving credit card loan growth, the addition of the existing HBC credit card loan portfolio of $1.4 billion
in the first quarter of 2011 and the addition of the existing Kohl’s private-label credit card loan portfolio of
$3.7 billion in the second quarter of 2011.
•Net Interest Margin: The increase in our net interest margin in 2011 reflected the favorable impact of a
reduction in cost of funds, which was partially offset by the unfavorable impact of a decrease in the average
yield on interest-earning assets. The improvement in our cost of funds was attributable the shift in the mix
of our funding to lower cost consumer and commercial banking deposits from higher cost wholesale sources
and a decline in deposit interest rates as a result of the overall low interest rate environment. The decrease in
the average yield on interest-earning assets was largely due to the addition of the Kohl’s portfolio. Under
our partnership agreement with Kohl’s, we share a fixed percentage of revenues, consisting of finance
charges and late fees. We report revenues related to Kohl’s credit card loans on a net basis in our
consolidated financial statements, which has the effect of reducing the yield on our average interest-earning
assets. The reduction in the average yield due to the addition of the Kohl’s portfolio was partially offset by
the run-off of lower margin installment loans, a reduced level of new accounts with low introductory
promotional rates and an increase in the recognition of billed finance charges and fees due to improved
credit performance as well as a change we made in the third quarter of 2011 in our estimation of the
uncollectible finance charge and fee reserve.
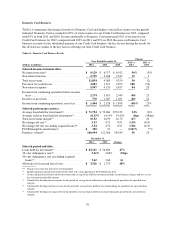
Non-Interest Income
Non-interest income primarily consists of service charges and other customer-related fees, interchange income
(net of rewards expense), other non-interest income and, in 2012, the bargain purchase gain attributable to the
ING Direct acquisition. The “other” component of non-interest income includes the provision for mortgage
representation and warranty losses related to continuing operations. Other also includes gains and losses from the
sale of investment securities, gains and losses on derivatives not accounted for in hedge accounting relationships
and hedge ineffectiveness, which we generally do not allocate to our business segments because they relate to
centralized asset/liability and market risk management activities undertaken by our Corporate Treasury group.
61