Capital One 2012 Annual Report Download - page 87
Download and view the complete annual report
Please find page 87 of the 2012 Capital One annual report below. You can navigate through the pages in the report by either clicking on the pages listed below, or by using the keyword search tool below to find specific information within the annual report.-
 1
1 -
2
-
3
-
4
-
5
-
6
-
7
-
8
-
9
-
10
-
11
-
12
-
13
-
14
-
15
-
16
-
17
-
18
-
19
-
20
-
21
-
22
-
23
-
24
-
25
-
26
-
27
-
28
-
29
-
30
-
31
-
32
-
33
-
34
-
35
-
36
-
37
-
38
-
39
-
40
-
41
-
42
-
43
-
44
-
45
-
46
-
47
-
48
-
49
-
50
-
51
-
52
-
53
-
54
-
55
-
56
-
57
-
58
-
59
-
60
-
61
-
62
-
63
-
64
-
65
-
66
-
67
-
68
-
69
-
70
-
71
-
72
-
73
-
74
-
75
-
76
-
 77
77 -
 78
78 -
 79
79 -
 80
80 -
 81
81 -
 82
82 -
 83
83 -
 84
84 -
 85
85 -
 86
86 -
 87
87 -
 88
88 -
 89
89 -
 90
90 -
 91
91 -
 92
92 -
 93
93 -
 94
94 -
 95
95 -
 96
96 -
 97
97 -
98
-
99
-
100
-
101
-
102
-
103
-
104
-
105
-
106
-
107
-
108
-
109
-
110
-
111
-
112
-
113
-
114
-
115
-
116
-
117
-
118
-
119
-
120
-
121
-
122
-
123
-
124
-
125
-
126
-
127
-
128
-
129
-
130
-
131
-
132
-
133
-
134
-
135
-
136
-
137
-
138
-
139
-
140
-
141
-
142
-
143
-
144
-
145
-
146
-
147
-
148
-
149
-
150
-
151
-
152
-
153
-
154
-
155
-
156
-
157
-
158
-
159
-
160
-
161
-
162
-
163
-
164
-
165
-
166
-
167
-
168
-
169
-
170
-
171
-
172
-
173
-
174
-
175
-
176
-
177
-
178
-
179
-
180
-
181
-
182
-
183
-
184
-
185
-
186
-
187
-
188
-
189
-
190
-
191
-
192
-
193
-
194
-
195
-
196
-
197
-
198
-
199
-
200
-
201
-
202
-
203
-
204
-
205
-
206
-
207
-
208
-
209
-
210
-
211
-
212
-
213
-
214
-
215
-
216
-
217
-
218
-
219
-
220
-
221
-
222
-
223
-
224
-
225
-
226
-
227
-
228
-
229
-
230
-
231
-
232
-
233
-
234
-
235
-
236
-
237
-
238
-
239
-
240
-
241
-
242
-
243
-
244
-
245
-
246
-
247
-
248
-
249
-
250
-
251
-
252
-
253
-
254
-
255
-
256
-
257
-
258
-
259
-
260
-
261
-
262
-
263
-
264
-
265
-
266
-
267
-
268
-
269
-
270
-
271
-
272
-
273
-
274
-
275
-
276
-
277
-
278
-
279
-
280
-
281
-
282
-
283
-
284
-
285
-
286
-
287
-
288
-
289
-
290
-
291
-
292
-
293
-
294
-
295
-
296
-
297
-
298
-
299
-
300
-
301
-
302
-
303
-
304
-
305
-
306
-
307
-
308
-
309
-
310
-
311
 |
 |
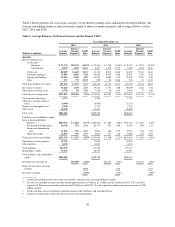
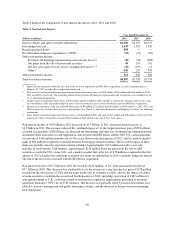
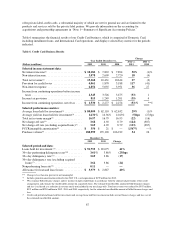
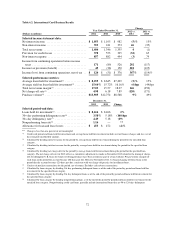
(4) Calculated by dividing interest income for the period by average loans held for investment during the period for the specified loan
category.
(5) Calculated by dividing total net revenue for the period by average loans held for investment during the period for the specified loan
category.
(6) Calculated by dividing net charge-offs for the period by average loans held for investment during the period for the specified loan
category. The net charge-off rate for 2012 reflects a cumulative adjustment we made in November 2012 related to the timing of charge-
offs for delinquent U.K. loans for which revolving privileges have been revoked as part of a loan workout. We previously charged off
such loans in the period the account became 180 days past due. Effective November 2012, we began charging off these loans in the
period that the account becomes 120 days past due, consistent with our charge-off practice for installment loans.
(7) Calculation of ratio adjusted to exclude from the denominator acquired loans accounted for subsequent to acquisition based on expected
cash flows to be collected. See “Item 6. Selected Financial Data,” “Credit Risk Profile” and “Note 5—Loans—Credit Quality” for
additional information on the impact of acquired loans on our credit quality metrics.
(8) Includes amortization expense of $334 million in 2012 related to the purchased credit card relationships intangible asset of $2.2 billion
recorded in connection with the closing on May 1, 2012 of the 2012 U.S. card acquisition.
(9) Consists of purchase transactions for the period, net of returns. Excludes cash advance transactions.
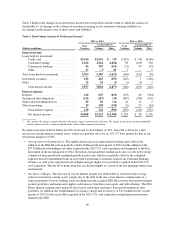
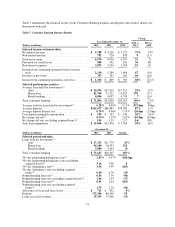
(10) Calculated by loan category by dividing 30+ day performing delinquent loans as of the end of the period by period-end loans held for
investment for the specified loan category.
(11) Calculated by loan category by dividing 30+ day delinquent loans as of the end of the period by period-end loans held for investment for
the specified loan category.
(12) Calculated by loan category by dividing nonperforming loans as of the end of the period by period-end loans held for investment for the
specified loan category. Nonperforming credit card loans generally include international loans that are 90 or 120 days delinquent.
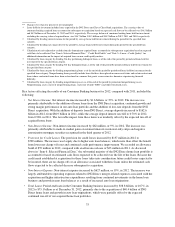
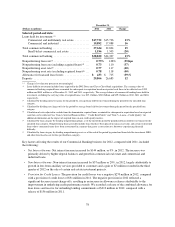
Key factors affecting the results of our Credit Card business for 2012, compared with 2011 included the
following:
•Net Interest Income: Net interest income increased by $2.4 billion, or 30%, in 2012, primarily attributable to
the substantial increase in average loans held for investment resulting from the 2012 U.S. card acquisition in
the second quarter of 2012, which was partially offset by a modest reduction in average loan yields due to
the establishment of a finance charge and fee reserve for the loans acquired in the 2012 U.S. card acquisition
and net premium amortization related to these loans.
•Non-Interest Income: Non-interest income increased by $469 million, or 18%, in 2012. The increase was
primarily driven by higher net interchange fees generated from purchase volume growth and customer-
related fees resulting from the addition of customer accounts associated with the 2012 U.S. card acquisition
in the second quarter of 2012. This increase was partially offset by charges of approximately $115 million
expected refunds to customers affected by certain cross-sell activities in our Domestic Card business and the
discontinuance of revenue recognition for billings to customers affected by the cross-sell activities.
•Provision for Credit Losses: The provision for credit losses related to our Credit Card business increased to
$4.1 billion in 2012, from $1.9 billion in 2011. The significant increase in the provision in 2012 was
primarily driven by the provision of $1.2 billion recorded in the second quarter of 2012 to establish an
allowance for the receivables acquired in the 2012 U.S. card acquisition with revolving privileges. We
recorded an additional provision for credit losses for these loans of $107 million in the second half of 2012.
The provision for credit losses, excluding the allowance build related to the receivables acquired in the 2012
U.S. card acquisition, totaled $2.8 billion in 2012, reflecting a relative stabilization in credit performance
improvement compared to significant credit performance improvement in 2011 that resulted in a large
allowance release of $1.2 billion in 2011.
•Non-Interest Expense: Non-interest expense increased by $1.8 billion, or 36%, in 2012. The increase was
largely due to higher operating expenses resulting from the 2012 U.S. card acquisition and the amortization
of intangibles and other assets associated with the 2012 U.S. card acquisition, including PCCR intangible
amortization expense of $334 million in 2012. Other items contributing to the increase in non-interest
expense include merger-related expenses associated with the 2012 U.S. card acquisition, expense of $75
million recognized in the first quarter of 2012 for expected customer refunds attributable to issues
associated with cross-selling certain other products to credit card customers, regulatory fines of $60 million
related to cross-sell activities in the Domestic Card business and expense of $98 million for net litigation
reserves to cover interchange and other legal matters in the second quarter of 2012.
68