Capital One 2012 Annual Report Download - page 92
Download and view the complete annual report
Please find page 92 of the 2012 Capital One annual report below. You can navigate through the pages in the report by either clicking on the pages listed below, or by using the keyword search tool below to find specific information within the annual report.-
 1
1 -
2
-
3
-
4
-
5
-
6
-
7
-
8
-
9
-
10
-
11
-
12
-
13
-
14
-
15
-
16
-
17
-
18
-
19
-
20
-
21
-
22
-
23
-
24
-
25
-
26
-
27
-
28
-
29
-
30
-
31
-
32
-
33
-
34
-
35
-
36
-
37
-
38
-
39
-
40
-
41
-
42
-
43
-
44
-
45
-
46
-
47
-
48
-
49
-
50
-
51
-
52
-
53
-
54
-
55
-
56
-
57
-
58
-
59
-
60
-
61
-
62
-
63
-
64
-
65
-
66
-
67
-
68
-
69
-
70
-
71
-
72
-
73
-
74
-
75
-
76
-
77
-
78
-
79
-
80
-
81
-
 82
82 -
 83
83 -
 84
84 -
 85
85 -
 86
86 -
 87
87 -
 88
88 -
 89
89 -
 90
90 -
 91
91 -
 92
92 -
 93
93 -
 94
94 -
 95
95 -
 96
96 -
 97
97 -
 98
98 -
 99
99 -
 100
100 -
 101
101 -
 102
102 -
103
-
104
-
105
-
106
-
107
-
108
-
109
-
110
-
111
-
112
-
113
-
114
-
115
-
116
-
117
-
118
-
119
-
120
-
121
-
122
-
123
-
124
-
125
-
126
-
127
-
128
-
129
-
130
-
131
-
132
-
133
-
134
-
135
-
136
-
137
-
138
-
139
-
140
-
141
-
142
-
143
-
144
-
145
-
146
-
147
-
148
-
149
-
150
-
151
-
152
-
153
-
154
-
155
-
156
-
157
-
158
-
159
-
160
-
161
-
162
-
163
-
164
-
165
-
166
-
167
-
168
-
169
-
170
-
171
-
172
-
173
-
174
-
175
-
176
-
177
-
178
-
179
-
180
-
181
-
182
-
183
-
184
-
185
-
186
-
187
-
188
-
189
-
190
-
191
-
192
-
193
-
194
-
195
-
196
-
197
-
198
-
199
-
200
-
201
-
202
-
203
-
204
-
205
-
206
-
207
-
208
-
209
-
210
-
211
-
212
-
213
-
214
-
215
-
216
-
217
-
218
-
219
-
220
-
221
-
222
-
223
-
224
-
225
-
226
-
227
-
228
-
229
-
230
-
231
-
232
-
233
-
234
-
235
-
236
-
237
-
238
-
239
-
240
-
241
-
242
-
243
-
244
-
245
-
246
-
247
-
248
-
249
-
250
-
251
-
252
-
253
-
254
-
255
-
256
-
257
-
258
-
259
-
260
-
261
-
262
-
263
-
264
-
265
-
266
-
267
-
268
-
269
-
270
-
271
-
272
-
273
-
274
-
275
-
276
-
277
-
278
-
279
-
280
-
281
-
282
-
283
-
284
-
285
-
286
-
287
-
288
-
289
-
290
-
291
-
292
-
293
-
294
-
295
-
296
-
297
-
298
-
299
-
300
-
301
-
302
-
303
-
304
-
305
-
306
-
307
-
308
-
309
-
310
-
311
 |
 |
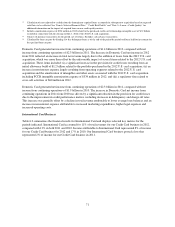
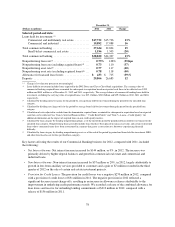
Our International Card business generated net income from continuing operations of $126 million in 2012,
compared with a net loss from continuing operations of $51 million in 2011. The International Card net income
in 2012, compared with net loss in 2011, was driven by a decrease in the provision for credit losses, attributable
to lower net charge-offs resulting from credit improvement in Canada and the U.K., and the absence of an
allowance build of $105 million for the HBC loan portfolio we acquired in January 2011.
Our International Card business generated a net loss from continuing operations of $51 million in 2011,
compared with net income from continuing operations of $376 million in 2010. The International Card net loss in
2011, compared with net income in 2010, was attributable to a decrease in total net revenue resulting from
contra-revenue amounts of $174 million recorded in 2011 for anticipated refunds to U.K. customers related to
retrospective regulatory requirements pertaining to PPI insurance in our U.K. business and the impact of the
addition of the HBC loan portfolio in 2011. The HBC portfolio contributed to an increase in the provision for
credit losses and an increase in non-interest expense related to operating costs associated with HBC associates
who joined us as a result of the acquisition, which were partially offset by growth in net interest income due from
the higher loan balances.
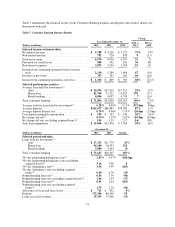
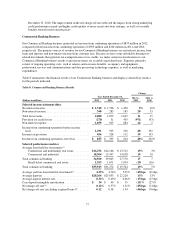
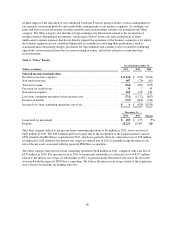
Consumer Banking Business
Our Consumer Banking business generated net income of $1.4 billion in 2012, compared with net income of
$809 million in 2011 and $905 million in 2010. The primary sources of revenue for our Consumer Banking
business are net interest income from loans and deposits and non-interest income from customer fees. Expenses
primarily consist of ongoing operating costs, such as salaries and associate benefits, occupancy and equipment,
professional services and communications and data processing technology expenses, as well as marketing
expenditures.
The substantial majority of the lending and retail deposit businesses acquired from the ING Direct acquisition on
February 17, 2012, which included loans with a carrying value of $40.4 billion and deposits of $84.4 billion at
acquisition, are reported in the Consumer Banking segment.
73