Capital One 2012 Annual Report Download - page 78
Download and view the complete annual report
Please find page 78 of the 2012 Capital One annual report below. You can navigate through the pages in the report by either clicking on the pages listed below, or by using the keyword search tool below to find specific information within the annual report.-
 1
1 -
2
-
3
-
4
-
5
-
6
-
7
-
8
-
9
-
10
-
11
-
12
-
13
-
14
-
15
-
16
-
17
-
18
-
19
-
20
-
21
-
22
-
23
-
24
-
25
-
26
-
27
-
28
-
29
-
30
-
31
-
32
-
33
-
34
-
35
-
36
-
37
-
38
-
39
-
40
-
41
-
42
-
43
-
44
-
45
-
46
-
47
-
48
-
49
-
50
-
51
-
52
-
53
-
54
-
55
-
56
-
57
-
58
-
59
-
60
-
61
-
62
-
63
-
64
-
65
-
66
-
67
-
 68
68 -
 69
69 -
 70
70 -
 71
71 -
 72
72 -
 73
73 -
 74
74 -
 75
75 -
 76
76 -
 77
77 -
 78
78 -
 79
79 -
 80
80 -
 81
81 -
 82
82 -
 83
83 -
 84
84 -
 85
85 -
 86
86 -
 87
87 -
 88
88 -
89
-
90
-
91
-
92
-
93
-
94
-
95
-
96
-
97
-
98
-
99
-
100
-
101
-
102
-
103
-
104
-
105
-
106
-
107
-
108
-
109
-
110
-
111
-
112
-
113
-
114
-
115
-
116
-
117
-
118
-
119
-
120
-
121
-
122
-
123
-
124
-
125
-
126
-
127
-
128
-
129
-
130
-
131
-
132
-
133
-
134
-
135
-
136
-
137
-
138
-
139
-
140
-
141
-
142
-
143
-
144
-
145
-
146
-
147
-
148
-
149
-
150
-
151
-
152
-
153
-
154
-
155
-
156
-
157
-
158
-
159
-
160
-
161
-
162
-
163
-
164
-
165
-
166
-
167
-
168
-
169
-
170
-
171
-
172
-
173
-
174
-
175
-
176
-
177
-
178
-
179
-
180
-
181
-
182
-
183
-
184
-
185
-
186
-
187
-
188
-
189
-
190
-
191
-
192
-
193
-
194
-
195
-
196
-
197
-
198
-
199
-
200
-
201
-
202
-
203
-
204
-
205
-
206
-
207
-
208
-
209
-
210
-
211
-
212
-
213
-
214
-
215
-
216
-
217
-
218
-
219
-
220
-
221
-
222
-
223
-
224
-
225
-
226
-
227
-
228
-
229
-
230
-
231
-
232
-
233
-
234
-
235
-
236
-
237
-
238
-
239
-
240
-
241
-
242
-
243
-
244
-
245
-
246
-
247
-
248
-
249
-
250
-
251
-
252
-
253
-
254
-
255
-
256
-
257
-
258
-
259
-
260
-
261
-
262
-
263
-
264
-
265
-
266
-
267
-
268
-
269
-
270
-
271
-
272
-
273
-
274
-
275
-
276
-
277
-
278
-
279
-
280
-
281
-
282
-
283
-
284
-
285
-
286
-
287
-
288
-
289
-
290
-
291
-
292
-
293
-
294
-
295
-
296
-
297
-
298
-
299
-
300
-
301
-
302
-
303
-
304
-
305
-
306
-
307
-
308
-
309
-
310
-
311
 |
 |

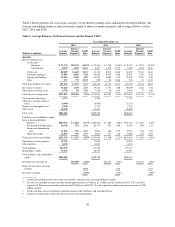
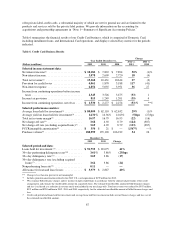
Table 2 below presents, for each major category of our interest-earning assets and interest-bearing liabilities, the
average outstanding balances, interest income earned or interest expense incurred, and average yield or cost for
2012, 2011 and 2010.
Table 2: Average Balances, Net Interest Income and Net Interest Yield(1)
Year Ended December 31,
2012 2011 2010
(Dollars in millions)
Average
Balance
Interest
Income/
Expense(2)
Yield/
Rate
Average
Balance
Interest
Income/
Expense(2)
Yield/
Rate
Average
Balance
Interest
Income/
Expense(2)
Yield/
Rate
Assets:
Interest-earning assets:
Credit card:(3)
Domestic .............. $ 71,754 $10,153 14.15% $ 53,465 $ 7,562 14.14% $ 55,133 $ 7,951 14.42%
International ........... 8,255 1,292 15.66 8,645 1,359 15.72 7,499 1,212 16.16
Credit card ................. 80,009 11,445 14.31 62,110 8,921 14.36 62,632 9,163 14.63
Consumer banking(4) ........ 71,836 4,509 6.28 34,838 3,343 9.60 35,925 3,245 9.11
Commercial banking ......... 35,913 1,528 4.25 31,274 1,482 4.74 29,764 1,503 5.05
Other ..................... 157 55 35.03 202 28 13.86 205 23 11.22
Total loans held for investment ..... 187,915 17,537 9.33 128,424 13,774 10.73 128,526 13,934 10.84
Investment securities ............. 57,424 1,329 2.31 39,513 1,137 2.88 39,489 1,342 3.40
Other interest-earning assets ....... 9,740 98 1.01 7,328 76 1.04 7,668 77 1.00
Total interest-earning assets ....... $255,079 $18,964 7.43% $175,265 $14,987 8.55% $175,683 $15,353 8.74%
Cash and due from banks ......... 4,573 1,926 2,132
Allowance for loan and lease
losses ....................... (4,640) (4,865) (7,257)
Premises and equipment, net ...... 3,342 2,731 2,718
Other assets .................... 28,248 24,661 26,838
Total assets .................... $286,602 $199,718 $200,114
Liabilities and stockholders’ equity:
Interest-bearing liabilities:
Deposits .................. $183,314 $ 1,403 0.77% $109,644 $ 1,187 1.08% $104,743 $ 1,465 1.40%
Securitized debt obligations . . . 14,138 271 1.92 20,715 422 2.04 34,185 809 2.37
Senior and subordinated
notes ................... 11,012 345 3.13 9,244 300 3.25 8,571 276 3.22
Other borrowings ........... 12,875 356 2.77 8,063 337 4.18 6,864 346 5.04
Total interest-bearing liabilities .... $221,339 $ 2,375 1.07% $147,666 $ 2,246 1.52% $154,363 $ 2,896 1.88%
Non-interest bearing deposits ...... 19,741 17,050 14,267
Other liabilities ................. 8,196 6,423 6,543
Total liabilities ................. 249,275 171,139 175,173
Stockholders’ equity ............. 37,327 28,579 24,941
Total liabilities and stockholders’
equity ...................... $286,602 $199,718 $200,114
Net interest income/spread ........ $16,589 6.36% $12,741 7.03% $12,457 6.86%
Impact of non-interest bearing
funding ..................... 0.14 0.24 0.23
Net interest margin .............. 6.50% 7.27% 7.09%
(1) Certain prior period amounts have been reclassified to conform to the current period presentation.
(2) Past due fees included in interest income totaled approximately $1.7 billion, $1.1 billion and $1.1 billion in 2012, 2011 and 2010,
respectively. Premium amortization related to the ING Direct and 2012 U.S. card acquisitions reduced net interest income by $391
million in 2012.
(3) Credit card loans consist of domestic and international credit card loans and installment loans.
(4) Consumer banking loans consist of auto, home and retail banking loans.
59