Capital One 2012 Annual Report Download - page 228
Download and view the complete annual report
Please find page 228 of the 2012 Capital One annual report below. You can navigate through the pages in the report by either clicking on the pages listed below, or by using the keyword search tool below to find specific information within the annual report.-
 1
1 -
2
-
3
-
4
-
5
-
6
-
7
-
8
-
9
-
10
-
11
-
12
-
13
-
14
-
15
-
16
-
17
-
18
-
19
-
20
-
21
-
22
-
23
-
24
-
25
-
26
-
27
-
28
-
29
-
30
-
31
-
32
-
33
-
34
-
35
-
36
-
37
-
38
-
39
-
40
-
41
-
42
-
43
-
44
-
45
-
46
-
47
-
48
-
49
-
50
-
51
-
52
-
53
-
54
-
55
-
56
-
57
-
58
-
59
-
60
-
61
-
62
-
63
-
64
-
65
-
66
-
67
-
68
-
69
-
70
-
71
-
72
-
73
-
74
-
75
-
76
-
77
-
78
-
79
-
80
-
81
-
82
-
83
-
84
-
85
-
86
-
87
-
88
-
89
-
90
-
91
-
92
-
93
-
94
-
95
-
96
-
97
-
98
-
99
-
100
-
101
-
102
-
103
-
104
-
105
-
106
-
107
-
108
-
109
-
110
-
111
-
112
-
113
-
114
-
115
-
116
-
117
-
118
-
119
-
120
-
121
-
122
-
123
-
124
-
125
-
126
-
127
-
128
-
129
-
130
-
131
-
132
-
133
-
134
-
135
-
136
-
137
-
138
-
139
-
140
-
141
-
142
-
143
-
144
-
145
-
146
-
147
-
148
-
149
-
150
-
151
-
152
-
153
-
154
-
155
-
156
-
157
-
158
-
159
-
160
-
161
-
162
-
163
-
164
-
165
-
166
-
167
-
168
-
169
-
170
-
171
-
172
-
173
-
174
-
175
-
176
-
177
-
178
-
179
-
180
-
181
-
182
-
183
-
184
-
185
-
186
-
187
-
188
-
189
-
190
-
191
-
192
-
193
-
194
-
195
-
196
-
197
-
198
-
199
-
200
-
201
-
202
-
203
-
204
-
205
-
206
-
207
-
208
-
209
-
210
-
211
-
212
-
213
-
214
-
215
-
216
-
217
-
 218
218 -
 219
219 -
 220
220 -
 221
221 -
 222
222 -
 223
223 -
 224
224 -
 225
225 -
 226
226 -
 227
227 -
 228
228 -
 229
229 -
 230
230 -
 231
231 -
 232
232 -
 233
233 -
 234
234 -
 235
235 -
 236
236 -
 237
237 -
 238
238 -
239
-
240
-
241
-
242
-
243
-
244
-
245
-
246
-
247
-
248
-
249
-
250
-
251
-
252
-
253
-
254
-
255
-
256
-
257
-
258
-
259
-
260
-
261
-
262
-
263
-
264
-
265
-
266
-
267
-
268
-
269
-
270
-
271
-
272
-
273
-
274
-
275
-
276
-
277
-
278
-
279
-
280
-
281
-
282
-
283
-
284
-
285
-
286
-
287
-
288
-
289
-
290
-
291
-
292
-
293
-
294
-
295
-
296
-
297
-
298
-
299
-
300
-
301
-
302
-
303
-
304
-
305
-
306
-
307
-
308
-
309
-
310
-
311
 |
 |
CAPITAL ONE FINANCIAL CORPORATION
NOTES TO CONSOLIDATED FINANCIAL STATEMENTS—(Continued)
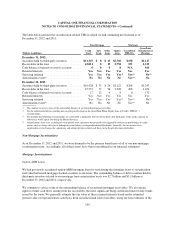
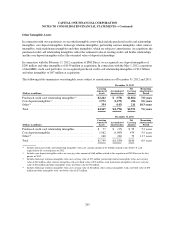
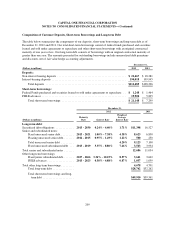
Composition of Customer Deposits, Short-term Borrowings and Long-term Debt
The table below summarizes the components of our deposits, short-term borrowings and long-term debt as of
December 31, 2012 and 2011. Our total short-term borrowings consist of federal funds purchased and securities
loaned and sold under agreements to repurchase and other short-term borrowings with an original contractual
maturity of one year or less. Our long-term debt consists of borrowings with an original contractual maturity of
greater than one year. The amounts presented for outstanding borrowings include unamortized debt premiums
and discounts, net of fair value hedge accounting adjustments.
December 31,
(Dollars in millions) 2012 2011
Deposits:
Non-interest bearing deposits ................................................ $ 22,467 $ 18,281
Interest-bearing deposits .................................................... 190,018 109,945
Total deposits ........................................................ $212,485 $128,226
Short-term borrowings:
Federal Funds purchased and securities loaned or sold under agreements to repurchase . . $ 1,248 $ 1,464
FHLB advances ........................................................... 19,900 5,835
Total short-term borrowings ............................................. $ 21,148 $ 7,299
December 31,
2012 2011
(Dollars in millions)
Maturity
Date Interest Rate
Weighted
Average
Interest Rate
Long-term debt:
Securitized debt obligations ............. 2013 - 2030 0.24% - 6.40% 1.71% $11,398 16,527
Senior and subordinated notes:
Fixed unsecured senior debt ......... 2013 - 2021 1.00% - 7.38% 4.38% 8,623 6,850
Floating unsecured senior debt ....... 2014 - 2015 0.95% - 1.49% 1.22% 500 250
Total unsecured senior debt ......... 4.20% 9,123 7,100
Fixed unsecured subordinated debt . . . 2013 - 2019 5.35% - 8.80% 7.46% 3,563 3,934
Total senior and subordinated notes ....... 12,686 11,034
Other long-term borrowings:
Fixed junior subordinated debt ....... 2027 - 2066 3.36% - 10.25% 8.57% 3,641 3,642
FHLB advances ................... 2013 - 2023 0.38% - 6.88% 0.87% 1,037 1,059
Total other long-term borrowings ......... 4,678 4,701
Total long-term debt ............... $28,762 $32,262
Total short-term borrowings and long-
term debt ...................... $49,910 $39,561
209