Capital One 2012 Annual Report Download - page 155
Download and view the complete annual report
Please find page 155 of the 2012 Capital One annual report below. You can navigate through the pages in the report by either clicking on the pages listed below, or by using the keyword search tool below to find specific information within the annual report.-
 1
1 -
2
-
3
-
4
-
5
-
6
-
7
-
8
-
9
-
10
-
11
-
12
-
13
-
14
-
15
-
16
-
17
-
18
-
19
-
20
-
21
-
22
-
23
-
24
-
25
-
26
-
27
-
28
-
29
-
30
-
31
-
32
-
33
-
34
-
35
-
36
-
37
-
38
-
39
-
40
-
41
-
42
-
43
-
44
-
45
-
46
-
47
-
48
-
49
-
50
-
51
-
52
-
53
-
54
-
55
-
56
-
57
-
58
-
59
-
60
-
61
-
62
-
63
-
64
-
65
-
66
-
67
-
68
-
69
-
70
-
71
-
72
-
73
-
74
-
75
-
76
-
77
-
78
-
79
-
80
-
81
-
82
-
83
-
84
-
85
-
86
-
87
-
88
-
89
-
90
-
91
-
92
-
93
-
94
-
95
-
96
-
97
-
98
-
99
-
100
-
101
-
102
-
103
-
104
-
105
-
106
-
107
-
108
-
109
-
110
-
111
-
112
-
113
-
114
-
115
-
116
-
117
-
118
-
119
-
120
-
121
-
122
-
123
-
124
-
125
-
126
-
127
-
128
-
129
-
130
-
131
-
132
-
133
-
134
-
135
-
136
-
137
-
138
-
139
-
140
-
141
-
142
-
143
-
144
-
 145
145 -
 146
146 -
 147
147 -
 148
148 -
 149
149 -
 150
150 -
 151
151 -
 152
152 -
 153
153 -
 154
154 -
 155
155 -
 156
156 -
 157
157 -
 158
158 -
 159
159 -
 160
160 -
 161
161 -
 162
162 -
 163
163 -
 164
164 -
 165
165 -
166
-
167
-
168
-
169
-
170
-
171
-
172
-
173
-
174
-
175
-
176
-
177
-
178
-
179
-
180
-
181
-
182
-
183
-
184
-
185
-
186
-
187
-
188
-
189
-
190
-
191
-
192
-
193
-
194
-
195
-
196
-
197
-
198
-
199
-
200
-
201
-
202
-
203
-
204
-
205
-
206
-
207
-
208
-
209
-
210
-
211
-
212
-
213
-
214
-
215
-
216
-
217
-
218
-
219
-
220
-
221
-
222
-
223
-
224
-
225
-
226
-
227
-
228
-
229
-
230
-
231
-
232
-
233
-
234
-
235
-
236
-
237
-
238
-
239
-
240
-
241
-
242
-
243
-
244
-
245
-
246
-
247
-
248
-
249
-
250
-
251
-
252
-
253
-
254
-
255
-
256
-
257
-
258
-
259
-
260
-
261
-
262
-
263
-
264
-
265
-
266
-
267
-
268
-
269
-
270
-
271
-
272
-
273
-
274
-
275
-
276
-
277
-
278
-
279
-
280
-
281
-
282
-
283
-
284
-
285
-
286
-
287
-
288
-
289
-
290
-
291
-
292
-
293
-
294
-
295
-
296
-
297
-
298
-
299
-
300
-
301
-
302
-
303
-
304
-
305
-
306
-
307
-
308
-
309
-
310
-
311
 |
 |

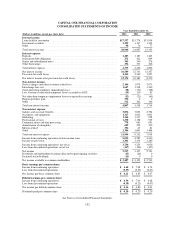
CAPITAL ONE FINANCIAL CORPORATION
CONSOLIDATED STATEMENTS OF CASH FLOWS
Year Ended December 31,
(Dollars in millions) 2012 2011 2010
Operating activities:
Income from continuing operations, net of tax ........................................ $ 3,734 $ 3,253 $ 3,050
Loss from discontinued operations, net of tax ......................................... (217) (106) (307)
Net income .................................................................... 3,517 3,147 2,743
Adjustments to reconcile net income to cash provided by operating activities:
Provision for credit losses .................................................... 4,415 2,360 3,907
Depreciation and amortization, net ............................................. 1,862 579 517
Net gains on sales of securities available for sale .................................. (45) (259) (141)
Impairment loss on securities available for sale ................................... 52 21 65
Net gains on deconsolidation .................................................. 00 (177)
Bargain purchase gain ....................................................... (594) 00
Loans held for sale: .........................................................
Originations ........................................................... (1,699) (1,031) (180)
Gains on sales .......................................................... (58) (28) (1)
Proceeds from sales and paydowns ......................................... 2,228 1,086 241
Stock plan compensation expense .............................................. 199 189 149
Changes in operating assets and liabilities, net of the effect of acquired businesses: .......
(Increase) decrease in interest receivable ..................................... (495) 41 (137)
(Increase) decrease in other assets .......................................... (1,033) (126) 957
Decrease in interest payable ............................................... (47) (22) (21)
Increase (decrease) in other liabilities ....................................... 798 1,403 (133)
Net cash provided by (used in) operating activities attributable to discontinued
operations ............................................................... (40) 95 353
Net cash provided by operating activities ........................................ 9,060 7,455 8,142
Investing activities:
Increase in restricted cash for securitization investors ................................... 363 811 2,897
Purchases of securities available for sale ............................................. (29,257) (16,060) (26,378)
Proceeds from paydowns and maturities of securities available for sale ..................... 17,779 9,710 11,567
Proceeds from sales of securities available for sale ..................................... 16,894 9,169 12,466
Proceeds from sale of interest-only bonds ............................................ 00 57
Net (increase) decrease in loans held for investment .................................... (7,141) (13,777) 2,607
Principal recoveries of loans previously charged off .................................... 1,538 1,543 1,587
Additions of premises and equipment ............................................... (560) (315) (340)
Net cash payment for companies acquired, net of cash received ........................... (17,603) (1,444) 0
Net cash (used in) provided by investing activities ................................. (17,987) (10,363) 4,463
Financing activities:
Net (decrease) increase in deposits ................................................. (156) 6,010 6,401
Net decrease in securitized debt obligations .......................................... (5,129) (10,388) (21,385)
Net increase (decrease) in other borrowings .......................................... 13,819 5,774 (293)
Maturities of senior notes ......................................................... (632) (855) (666)
Issuance of senior and subordinated notes and junior subordinated debt .................... 2,248 2,992 0
Purchases of treasury stock ....................................................... (43) (42) (22)
Dividends paid on common stock .................................................. (111 ) (91) (91)
Dividends paid on preferred stock .................................................. (15 ) 00
Net proceeds from issuances of common stock ........................................ 3,233 40 30
Net proceeds from issuances of preferred stock ....................................... 853 00
Proceeds from share-based payment activities ........................................ 80 57 3
Net cash provided by (used in) financing activities attributable to discontinued operations ..... 00 (18)
Net cash provided by (used in) financing activities ................................. 14,147 3,497 (16,041)
Increase (decrease) in cash and cash equivalents ....................................... 5,220 589 (3,436)
Cash and cash equivalents at beginning of the period ................................... 5,838 5,249 8,685
Cash and cash equivalents at end of the period ........................................ $ 11,058 $ 5,838 $ 5,249
Supplemental cash flow information:
Non-cash items:
Fair value of common stock issued in business acquisition ........................... $ 2,638 $0$0
Cumulative effect from adoption of new consolidation accounting standards ............ 00 2,973
See Notes to Consolidated Financial Statements.
136