Capital One 2012 Annual Report Download - page 240
Download and view the complete annual report
Please find page 240 of the 2012 Capital One annual report below. You can navigate through the pages in the report by either clicking on the pages listed below, or by using the keyword search tool below to find specific information within the annual report.-
 1
1 -
2
-
3
-
4
-
5
-
6
-
7
-
8
-
9
-
10
-
11
-
12
-
13
-
14
-
15
-
16
-
17
-
18
-
19
-
20
-
21
-
22
-
23
-
24
-
25
-
26
-
27
-
28
-
29
-
30
-
31
-
32
-
33
-
34
-
35
-
36
-
37
-
38
-
39
-
40
-
41
-
42
-
43
-
44
-
45
-
46
-
47
-
48
-
49
-
50
-
51
-
52
-
53
-
54
-
55
-
56
-
57
-
58
-
59
-
60
-
61
-
62
-
63
-
64
-
65
-
66
-
67
-
68
-
69
-
70
-
71
-
72
-
73
-
74
-
75
-
76
-
77
-
78
-
79
-
80
-
81
-
82
-
83
-
84
-
85
-
86
-
87
-
88
-
89
-
90
-
91
-
92
-
93
-
94
-
95
-
96
-
97
-
98
-
99
-
100
-
101
-
102
-
103
-
104
-
105
-
106
-
107
-
108
-
109
-
110
-
111
-
112
-
113
-
114
-
115
-
116
-
117
-
118
-
119
-
120
-
121
-
122
-
123
-
124
-
125
-
126
-
127
-
128
-
129
-
130
-
131
-
132
-
133
-
134
-
135
-
136
-
137
-
138
-
139
-
140
-
141
-
142
-
143
-
144
-
145
-
146
-
147
-
148
-
149
-
150
-
151
-
152
-
153
-
154
-
155
-
156
-
157
-
158
-
159
-
160
-
161
-
162
-
163
-
164
-
165
-
166
-
167
-
168
-
169
-
170
-
171
-
172
-
173
-
174
-
175
-
176
-
177
-
178
-
179
-
180
-
181
-
182
-
183
-
184
-
185
-
186
-
187
-
188
-
189
-
190
-
191
-
192
-
193
-
194
-
195
-
196
-
197
-
198
-
199
-
200
-
201
-
202
-
203
-
204
-
205
-
206
-
207
-
208
-
209
-
210
-
211
-
212
-
213
-
214
-
215
-
216
-
217
-
218
-
219
-
220
-
221
-
222
-
223
-
224
-
225
-
226
-
227
-
228
-
229
-
 230
230 -
 231
231 -
 232
232 -
 233
233 -
 234
234 -
 235
235 -
 236
236 -
 237
237 -
 238
238 -
 239
239 -
 240
240 -
 241
241 -
 242
242 -
 243
243 -
 244
244 -
 245
245 -
 246
246 -
 247
247 -
 248
248 -
 249
249 -
 250
250 -
251
-
252
-
253
-
254
-
255
-
256
-
257
-
258
-
259
-
260
-
261
-
262
-
263
-
264
-
265
-
266
-
267
-
268
-
269
-
270
-
271
-
272
-
273
-
274
-
275
-
276
-
277
-
278
-
279
-
280
-
281
-
282
-
283
-
284
-
285
-
286
-
287
-
288
-
289
-
290
-
291
-
292
-
293
-
294
-
295
-
296
-
297
-
298
-
299
-
300
-
301
-
302
-
303
-
304
-
305
-
306
-
307
-
308
-
309
-
310
-
311
 |
 |

CAPITAL ONE FINANCIAL CORPORATION
NOTES TO CONSOLIDATED FINANCIAL STATEMENTS—(Continued)
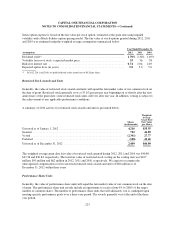
Year Ended December 31,
(Dollars and shares in millions, except per share data) 2012 2011 2010
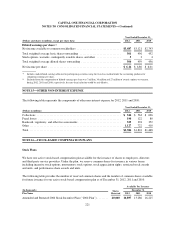
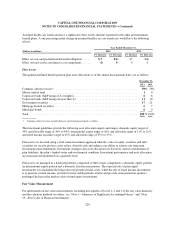
Diluted earnings per share(2)
Net income available to common stockholders ............................... $3,487 $3,121 $2,743
Total weighted-average basic shares outstanding ............................. 561 456 452
Stock options, warrants, contingently issuable shares, and other ................. 534
Total weighted-average diluted shares outstanding ............................ 566 459 456
Net income per share ................................................... $ 6.16 $ 6.80 $ 6.01
(1) Includes undistributed earnings allocated to participating securities using the two-class method under the accounting guidance for
computing earnings per share.
(2) Excluded from the computation of diluted earnings per share was 7 million, 30 million and 27 million of awards, options or warrants,
during 2012, 2011 and 2010, respectively, because their inclusion would be anti-dilutive.
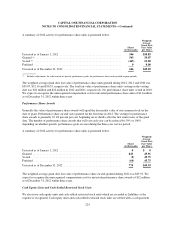
NOTE 15—OTHER NON-INTEREST EXPENSE
The following table represents the components of other non-interest expense for 2012, 2011 and 2010:
Year Ended December 31,
(Dollars in millions) 2012 2011 2010
Collections ........................................................... $ 544 $ 563 $ 626
Fraud losses .......................................................... 190 122 80
Bankcard, regulatory, and other fee assessments .............................. 525 394 352
Other ................................................................ 1,127 722 410
Total ................................................................ $2,386 $1,801 $1,468
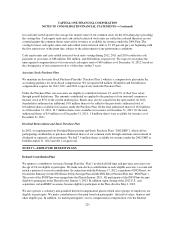
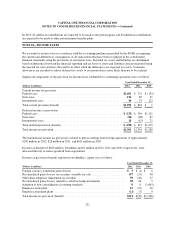
NOTE 16—STOCK-BASED COMPENSATION PLANS
Stock Plans
We have one active stock-based compensation plan available for the issuance of shares to employees, directors
and third-party service providers. Under the plan, we reserve common shares for issuance in various forms,
including incentive stock options, nonstatutory stock options, stock appreciation rights, restricted stock awards
and units, and performance share awards and units.
The following table provides the number of reserved common shares and the number of common shares available
for future issuance for our active stock-based compensation plan as of December 31, 2012, 2011 and 2010.
Shares
Reserved
Available For Issuance
(In thousands) December 31
Plan Name 2012 2011 2010
Amended and Restated 2004 Stock Incentive Plan (“2004 Plan”) ........ 40,000 10,897 13,286 16,225
221