Capital One 2012 Annual Report Download - page 247
Download and view the complete annual report
Please find page 247 of the 2012 Capital One annual report below. You can navigate through the pages in the report by either clicking on the pages listed below, or by using the keyword search tool below to find specific information within the annual report.-
 1
1 -
2
-
3
-
4
-
5
-
6
-
7
-
8
-
9
-
10
-
11
-
12
-
13
-
14
-
15
-
16
-
17
-
18
-
19
-
20
-
21
-
22
-
23
-
24
-
25
-
26
-
27
-
28
-
29
-
30
-
31
-
32
-
33
-
34
-
35
-
36
-
37
-
38
-
39
-
40
-
41
-
42
-
43
-
44
-
45
-
46
-
47
-
48
-
49
-
50
-
51
-
52
-
53
-
54
-
55
-
56
-
57
-
58
-
59
-
60
-
61
-
62
-
63
-
64
-
65
-
66
-
67
-
68
-
69
-
70
-
71
-
72
-
73
-
74
-
75
-
76
-
77
-
78
-
79
-
80
-
81
-
82
-
83
-
84
-
85
-
86
-
87
-
88
-
89
-
90
-
91
-
92
-
93
-
94
-
95
-
96
-
97
-
98
-
99
-
100
-
101
-
102
-
103
-
104
-
105
-
106
-
107
-
108
-
109
-
110
-
111
-
112
-
113
-
114
-
115
-
116
-
117
-
118
-
119
-
120
-
121
-
122
-
123
-
124
-
125
-
126
-
127
-
128
-
129
-
130
-
131
-
132
-
133
-
134
-
135
-
136
-
137
-
138
-
139
-
140
-
141
-
142
-
143
-
144
-
145
-
146
-
147
-
148
-
149
-
150
-
151
-
152
-
153
-
154
-
155
-
156
-
157
-
158
-
159
-
160
-
161
-
162
-
163
-
164
-
165
-
166
-
167
-
168
-
169
-
170
-
171
-
172
-
173
-
174
-
175
-
176
-
177
-
178
-
179
-
180
-
181
-
182
-
183
-
184
-
185
-
186
-
187
-
188
-
189
-
190
-
191
-
192
-
193
-
194
-
195
-
196
-
197
-
198
-
199
-
200
-
201
-
202
-
203
-
204
-
205
-
206
-
207
-
208
-
209
-
210
-
211
-
212
-
213
-
214
-
215
-
216
-
217
-
218
-
219
-
220
-
221
-
222
-
223
-
224
-
225
-
226
-
227
-
228
-
229
-
230
-
231
-
232
-
233
-
234
-
235
-
236
-
 237
237 -
 238
238 -
 239
239 -
 240
240 -
 241
241 -
 242
242 -
 243
243 -
 244
244 -
 245
245 -
 246
246 -
 247
247 -
 248
248 -
 249
249 -
 250
250 -
 251
251 -
 252
252 -
 253
253 -
 254
254 -
 255
255 -
 256
256 -
 257
257 -
258
-
259
-
260
-
261
-
262
-
263
-
264
-
265
-
266
-
267
-
268
-
269
-
270
-
271
-
272
-
273
-
274
-
275
-
276
-
277
-
278
-
279
-
280
-
281
-
282
-
283
-
284
-
285
-
286
-
287
-
288
-
289
-
290
-
291
-
292
-
293
-
294
-
295
-
296
-
297
-
298
-
299
-
300
-
301
-
302
-
303
-
304
-
305
-
306
-
307
-
308
-
309
-
310
-
311
 |
 |

CAPITAL ONE FINANCIAL CORPORATION
NOTES TO CONSOLIDATED FINANCIAL STATEMENTS—(Continued)
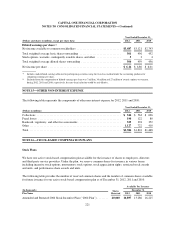
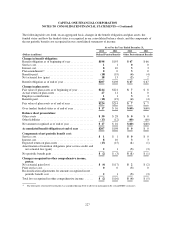
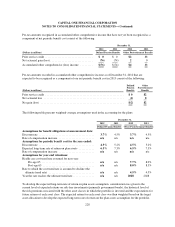
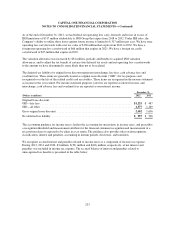
Pre-tax amounts recognized in accumulated other comprehensive income that have not yet been recognized as a
component of net periodic benefit cost consist of the following:
December 31,
2012 2011 2012 2011
(Dollars in millions) Defined Pension Benefits Other Postretirement Benefits
Prior service credit .................................. $0 $0 $2 $8
Net actuarial gain (loss) .............................. (76) (74) 20
Accumulated other comprehensive (loss) income ......... $(76) $(74) $4 $8
Pre-tax amounts recorded in accumulated other comprehensive income as of December 31, 2012 that are
expected to be recognized as a component of our net periodic benefit cost in 2013 consist of the following:
(Dollars in millions)
Defined
Pension
Benefits
Other
Postretirement
Benefits
Prior service credit ....................................................... $ 0 $2
Net actuarial loss ........................................................ (2) 0
Net gain (loss) .......................................................... $(2) $2
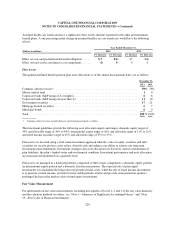
The following table presents weighted-average assumptions used in the accounting for the plans:
December 31,
2012 2011 2012 2011
Defined Pension Benefits Other Postretirement Benefits
Assumptions for benefit obligations at measurement date:
Discount rate ....................................... 3.7% 4.5% 3.7% 4.5%
Rate of compensation increase ......................... n/a n/a n/a n/a
Assumptions for periodic benefit cost for the year ended:
Discount rate ....................................... 4.5% 5.2% 4.5% 5.2%
Expected long-term rate of return on plan assets ........... 6.5% 7.3% 6.5% 7.3%
Rate of compensation increase ......................... n/a n/a n/a n/a
Assumptions for year-end valuations:
Health care cost trend rate assumed for next year:
Pre-age 65 ..................................... n/a n/a 7.7% 8.0%
Post-age 65 .................................... n/a n/a 8.0% 8.3%
Rate to which the cost trend rate is assumed to decline (the
ultimate trend rate) ................................ n/a n/a 4.5% 4.5%
Year the rate reaches the ultimate trend rate ............... n/a n/a 2028 2028
To develop the expected long-term rate of return on plan assets assumption, consideration was given to the
current level of expected returns on risk-free investments (primarily government bonds), the historical level of
the risk premium associated with the other asset classes in which the portfolio is invested and the expectations for
future returns of each asset class. The expected return for each asset class was then weighted based on the target
asset allocation to develop the expected long-term rate of return on the plan assets assumption for the portfolio.
228