Capital One 2012 Annual Report Download - page 304
Download and view the complete annual report
Please find page 304 of the 2012 Capital One annual report below. You can navigate through the pages in the report by either clicking on the pages listed below, or by using the keyword search tool below to find specific information within the annual report.-
 1
1 -
2
-
3
-
4
-
5
-
6
-
7
-
8
-
9
-
10
-
11
-
12
-
13
-
14
-
15
-
16
-
17
-
18
-
19
-
20
-
21
-
22
-
23
-
24
-
25
-
26
-
27
-
28
-
29
-
30
-
31
-
32
-
33
-
34
-
35
-
36
-
37
-
38
-
39
-
40
-
41
-
42
-
43
-
44
-
45
-
46
-
47
-
48
-
49
-
50
-
51
-
52
-
53
-
54
-
55
-
56
-
57
-
58
-
59
-
60
-
61
-
62
-
63
-
64
-
65
-
66
-
67
-
68
-
69
-
70
-
71
-
72
-
73
-
74
-
75
-
76
-
77
-
78
-
79
-
80
-
81
-
82
-
83
-
84
-
85
-
86
-
87
-
88
-
89
-
90
-
91
-
92
-
93
-
94
-
95
-
96
-
97
-
98
-
99
-
100
-
101
-
102
-
103
-
104
-
105
-
106
-
107
-
108
-
109
-
110
-
111
-
112
-
113
-
114
-
115
-
116
-
117
-
118
-
119
-
120
-
121
-
122
-
123
-
124
-
125
-
126
-
127
-
128
-
129
-
130
-
131
-
132
-
133
-
134
-
135
-
136
-
137
-
138
-
139
-
140
-
141
-
142
-
143
-
144
-
145
-
146
-
147
-
148
-
149
-
150
-
151
-
152
-
153
-
154
-
155
-
156
-
157
-
158
-
159
-
160
-
161
-
162
-
163
-
164
-
165
-
166
-
167
-
168
-
169
-
170
-
171
-
172
-
173
-
174
-
175
-
176
-
177
-
178
-
179
-
180
-
181
-
182
-
183
-
184
-
185
-
186
-
187
-
188
-
189
-
190
-
191
-
192
-
193
-
194
-
195
-
196
-
197
-
198
-
199
-
200
-
201
-
202
-
203
-
204
-
205
-
206
-
207
-
208
-
209
-
210
-
211
-
212
-
213
-
214
-
215
-
216
-
217
-
218
-
219
-
220
-
221
-
222
-
223
-
224
-
225
-
226
-
227
-
228
-
229
-
230
-
231
-
232
-
233
-
234
-
235
-
236
-
237
-
238
-
239
-
240
-
241
-
242
-
243
-
244
-
245
-
246
-
247
-
248
-
249
-
250
-
251
-
252
-
253
-
254
-
255
-
256
-
257
-
258
-
259
-
260
-
261
-
262
-
263
-
264
-
265
-
266
-
267
-
268
-
269
-
270
-
271
-
272
-
273
-
274
-
275
-
276
-
277
-
278
-
279
-
280
-
281
-
282
-
283
-
284
-
285
-
286
-
287
-
288
-
289
-
290
-
291
-
292
-
293
-
 294
294 -
 295
295 -
 296
296 -
 297
297 -
 298
298 -
 299
299 -
 300
300 -
 301
301 -
 302
302 -
 303
303 -
 304
304 -
 305
305 -
 306
306 -
 307
307 -
 308
308 -
 309
309 -
 310
310 -
 311
311
 |
 |

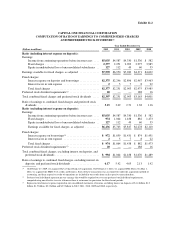
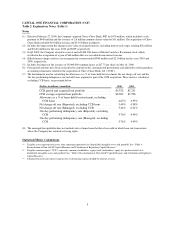
CAPITAL ONE FINANCIAL CORPORATION (COF)
Table 1: Financial & Statistical Summary—Reported GAAP Measures(8)
Year Ended December 31,
2010 2009(1)
(Dollars in millions) (Unaudited) Reported
Securitization
Adjustments Managed Reported
Securitization
Adjustments Managed
Earnings:
Net interest income ................... $ 12,457 $ 4 $ 12,461 $ 7,697 $ 4,392 $ 12,089
Non-interest income(2) ................ 3,714 2 3,716 5,286(3) (539) 4,747
Total net revenue (4) .................. $ 16,171 $ 6 $ 16,177 $ 12,983 $ 3,853 $ 16,836
Provision for credit losses .............. 3,907 6 3,913 4,230 3,853 8,083
Balance sheet statistics (period average)
Average loans held for investment ....... $128,526 $ 96 $128,622 $ 99,787 $43,727 $143,514
Average earning assets ................ 175,741 74 175,815 145,310 40,683 185,976
Average assets ....................... 200,114 71 200,185 171,598 41,060 212,658
Average liabilities .................... 175,173 71 175,244 144,992 41,060 186,052
Return on average assets (“ROA”) ....... 1.52% 0.21% 1.73% 0.58% (0.12)% 0.46%
Balance sheet statistics (period end)
Loans held for investment .............. $125,947 $ 0 $125,947 $ 90,619 $46,184 $136,803
Total assets ......................... 197,503 0 197,503 169,646 42,743 212,389
Total liabilities ...................... 170,962 0 170,962 143,057 42,767 185,824
Tangible assets (A) .................... 183,158 0 183,158 155,516 42,767 198,283
Tangible common equity (“TCE”) ratio
(B) ............................... 6.9% 0% 6.9% 8.0%(5) (1.7)% 6.3%
Performance statistics
Net interest income growth (year over
year) (6) .......................... 62% (59)% 3% 8% 2% 6%
Non-interest income growth (year over
year) (6) ........................... (30) 8 (22) (22)% 10% (12)%
Revenue growth (year over year) ........ 25 (29) (4) (7)% (7)% —%
Net interest margin ................... 7.09 0 7.09 5.30% 1.20% 6.50%
Revenue margin ..................... 9.20 0 9.20 8.94% 0.11% 9.05%
Non-interest expense as a% of average
loans held for investment
(annualized) ....................... 6.17 0 6.17 7.43% (2.26)% 5.17%
Efficiency ratio (C) .................... 49.06 0 49.06 56.21% (12.86)% 43.35%
Credit quality statistics
Net charge-offs ...................... $ 6,651 $ 6 $ 6,657 $ 4,568 $ 3,853 $ 8,421
Net charge-off rate (7) ................. 5.18% 0% 5.18% 4.58% 1.29% 5.87%
30+ day performing delinquencies ....... $ 4,430 $ 0 $ 4,430 $ 3,746 $ 2,719 $ 6,465
30+ day performing delinquency rate (7) . . 3.52% 0% 3.52% 4.13% 0.60% 4.73%
2