Capital One 2012 Annual Report Download - page 101
Download and view the complete annual report
Please find page 101 of the 2012 Capital One annual report below. You can navigate through the pages in the report by either clicking on the pages listed below, or by using the keyword search tool below to find specific information within the annual report.-
 1
1 -
2
-
3
-
4
-
5
-
6
-
7
-
8
-
9
-
10
-
11
-
12
-
13
-
14
-
15
-
16
-
17
-
18
-
19
-
20
-
21
-
22
-
23
-
24
-
25
-
26
-
27
-
28
-
29
-
30
-
31
-
32
-
33
-
34
-
35
-
36
-
37
-
38
-
39
-
40
-
41
-
42
-
43
-
44
-
45
-
46
-
47
-
48
-
49
-
50
-
51
-
52
-
53
-
54
-
55
-
56
-
57
-
58
-
59
-
60
-
61
-
62
-
63
-
64
-
65
-
66
-
67
-
68
-
69
-
70
-
71
-
72
-
73
-
74
-
75
-
76
-
77
-
78
-
79
-
80
-
81
-
82
-
83
-
84
-
85
-
86
-
87
-
88
-
89
-
90
-
 91
91 -
 92
92 -
 93
93 -
 94
94 -
 95
95 -
 96
96 -
 97
97 -
 98
98 -
 99
99 -
 100
100 -
 101
101 -
 102
102 -
 103
103 -
 104
104 -
 105
105 -
 106
106 -
 107
107 -
 108
108 -
 109
109 -
 110
110 -
 111
111 -
112
-
113
-
114
-
115
-
116
-
117
-
118
-
119
-
120
-
121
-
122
-
123
-
124
-
125
-
126
-
127
-
128
-
129
-
130
-
131
-
132
-
133
-
134
-
135
-
136
-
137
-
138
-
139
-
140
-
141
-
142
-
143
-
144
-
145
-
146
-
147
-
148
-
149
-
150
-
151
-
152
-
153
-
154
-
155
-
156
-
157
-
158
-
159
-
160
-
161
-
162
-
163
-
164
-
165
-
166
-
167
-
168
-
169
-
170
-
171
-
172
-
173
-
174
-
175
-
176
-
177
-
178
-
179
-
180
-
181
-
182
-
183
-
184
-
185
-
186
-
187
-
188
-
189
-
190
-
191
-
192
-
193
-
194
-
195
-
196
-
197
-
198
-
199
-
200
-
201
-
202
-
203
-
204
-
205
-
206
-
207
-
208
-
209
-
210
-
211
-
212
-
213
-
214
-
215
-
216
-
217
-
218
-
219
-
220
-
221
-
222
-
223
-
224
-
225
-
226
-
227
-
228
-
229
-
230
-
231
-
232
-
233
-
234
-
235
-
236
-
237
-
238
-
239
-
240
-
241
-
242
-
243
-
244
-
245
-
246
-
247
-
248
-
249
-
250
-
251
-
252
-
253
-
254
-
255
-
256
-
257
-
258
-
259
-
260
-
261
-
262
-
263
-
264
-
265
-
266
-
267
-
268
-
269
-
270
-
271
-
272
-
273
-
274
-
275
-
276
-
277
-
278
-
279
-
280
-
281
-
282
-
283
-
284
-
285
-
286
-
287
-
288
-
289
-
290
-
291
-
292
-
293
-
294
-
295
-
296
-
297
-
298
-
299
-
300
-
301
-
302
-
303
-
304
-
305
-
306
-
307
-
308
-
309
-
310
-
311
 |
 |
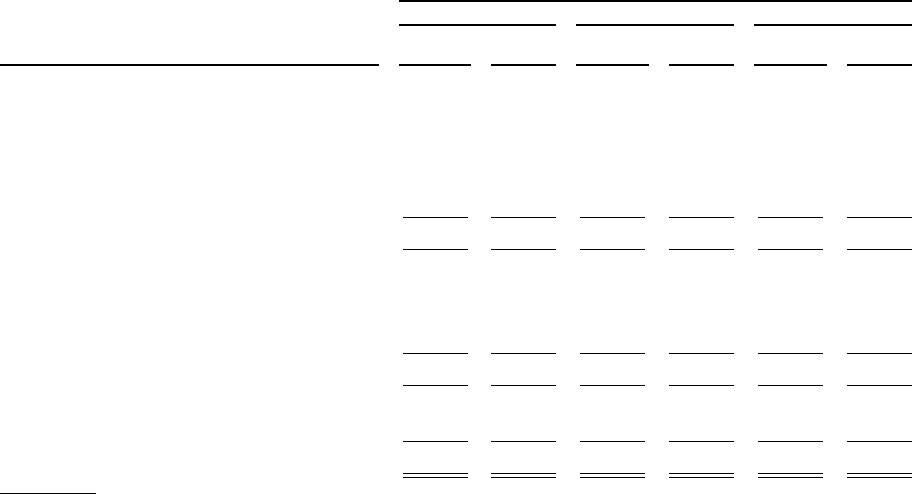
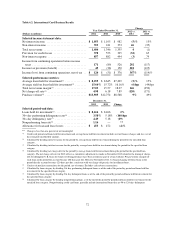
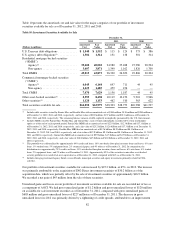
Table 10 presents the amortized cost and fair value for the major categories of our portfolio of investment
securities available for sale as of December 31, 2012, 2011 and 2010.
Table 10: Investment Securities Available for Sale
December 31,
2012 2011 2010
(Dollars in millions)
Amortized
Cost
Fair
Value
Amortized
Cost
Fair
Value
Amortized
Cost
Fair
Value
U.S. Treasury debt obligations ............. $ 1,548 $ 1,552 $ 115 $ 124 $ 373 $ 386
U.S. agency debt obligations(1) ............. 1,304 1,314 131 138 301 314
Residential mortgage-backed securities
(“RMBS”):
Agency(2) .......................... 39,408 40,002 24,980 25,488 27,980 28,504
Non-agency ........................ 3,607 3,871 1,340 1,162 1,826 1,700
Total RMBS ........................... 43,015 43,873 26,320 26,650 29,806 30,204
Commercial mortgage-backed securities
(“CMBS”):
Agency(2) ......................... 6,045 6,144 697 711 44 45
Non-agency ........................ 1,425 1,485 459 476 — —
Total CMBS ........................... 7,470 7,629 1,156 1,187 44 45
Other asset-backed securities(3) ............ 8,393 8,458 10,119 10,150 9,901 9,966
Other securities(4) ....................... 1,120 1,153 462 510 563 622
Total securities available for sale ........... $62,850 $63,979 $38,303 $38,759 $40,988 $41,537
(1) Includes debt securities issued by Fannie Mae and Freddie Mac with an amortized cost of $300 million, $130 million and $200 million as
of December 31, 2012, 2011 and 2010, respectively, and fair value of $302 million, $137 million and $213 million as of December 31,
2012, 2011 and 2010, respectively. The remaining balance consists of debt explicitly or implicitly guaranteed by the U.S. Government.
(2) Includes MBS issued by Fannie Mae, Freddie Mac and Ginnie Mae, each of which individually exceeded 10% of our stockholders’
equity as of the end of each reported period. Fannie Mae MBS had an amortized cost of $22.9 billion, $12.3 billion and $17.1 billion as
of December 31, 2012, 2011 and 2010, respectively, and a fair value of $23.2 billion, $12.6 billion and $17.3 billion as of December 31,
2012, 2011 and 2010, respectively. Freddie Mac MBS had an amortized cost of $12.6 billion, $8.9 billion and $8.1 billion as of
December 31, 2012, 2011 and 2010, respectively, and a fair value of $12.9 billion, $9.1 billion and $8.3 billion as of December 31, 2012,
2011 and 2010, respectively. Ginnie Mae MBS had an amortized cost of $9.9 billion, $4.5 billion and $2.9 billion as of December 31,
2012, 2011 and 2010, respectively, and a fair value of $10.0 billion, $4.5 billion and $3.0 billion as of December 31, 2012, 2011 and
2010, respectively.
(3) This portfolio was collateralized by approximately 64% credit card loans, 18% auto dealer floor plan inventory loans and leases, 6% auto
loans, 1% student loans, 5% equipment loans, 2% commercial paper, and 4% other as of December 31, 2012. In comparison, the
distribution was approximately 75% credit card loans, 11% auto dealer floor plan inventory loans and leases, 6% auto loans, 4% student
loans, 2% equipment loans, and 2% other as of December 31, 2011. Approximately 82% of the securities in our other asset-backed
security portfolio were rated AAA or its equivalent as of December 31, 2012, compared with 86% as of December 31, 2011.
(4) Includes foreign government/agency bonds, covered bonds, municipal securities and equity investments primarily related to CRA
activities.
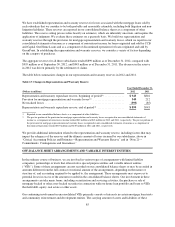
Our portfolio of investment securities available for sale increased by $25.2 billion, or 65%, in 2012. The increase
was primarily attributable to the acquisition of ING Direct investment securities of $30.2 billion as of the
acquisition date, which was partially offset by the sale of investment securities of approximately $16.9 billion.
We recorded a net gain of $45 million from the sale of these securities.
Unrealized gains and losses on our portfolio of investment securities available for sale are recorded net of tax as
a component of AOCI. We had gross unrealized gains of $1.2 billion and gross unrealized losses of $120 million
on available-for sale investment securities as of December 31, 2012, compared with gross unrealized gains of
$683 million and gross unrealized losses of $227 million as of December 31, 2011. The decrease in gross
unrealized losses in 2012 was primarily driven by a tightening of credit spreads, attributable to an improvement
82