Capital One 2012 Annual Report Download - page 137
Download and view the complete annual report
Please find page 137 of the 2012 Capital One annual report below. You can navigate through the pages in the report by either clicking on the pages listed below, or by using the keyword search tool below to find specific information within the annual report.-
 1
1 -
2
-
3
-
4
-
5
-
6
-
7
-
8
-
9
-
10
-
11
-
12
-
13
-
14
-
15
-
16
-
17
-
18
-
19
-
20
-
21
-
22
-
23
-
24
-
25
-
26
-
27
-
28
-
29
-
30
-
31
-
32
-
33
-
34
-
35
-
36
-
37
-
38
-
39
-
40
-
41
-
42
-
43
-
44
-
45
-
46
-
47
-
48
-
49
-
50
-
51
-
52
-
53
-
54
-
55
-
56
-
57
-
58
-
59
-
60
-
61
-
62
-
63
-
64
-
65
-
66
-
67
-
68
-
69
-
70
-
71
-
72
-
73
-
74
-
75
-
76
-
77
-
78
-
79
-
80
-
81
-
82
-
83
-
84
-
85
-
86
-
87
-
88
-
89
-
90
-
91
-
92
-
93
-
94
-
95
-
96
-
97
-
98
-
99
-
100
-
101
-
102
-
103
-
104
-
105
-
106
-
107
-
108
-
109
-
110
-
111
-
112
-
113
-
114
-
115
-
116
-
117
-
118
-
119
-
120
-
121
-
122
-
123
-
124
-
125
-
126
-
 127
127 -
 128
128 -
 129
129 -
 130
130 -
 131
131 -
 132
132 -
 133
133 -
 134
134 -
 135
135 -
 136
136 -
 137
137 -
 138
138 -
 139
139 -
 140
140 -
 141
141 -
 142
142 -
 143
143 -
 144
144 -
 145
145 -
 146
146 -
 147
147 -
148
-
149
-
150
-
151
-
152
-
153
-
154
-
155
-
156
-
157
-
158
-
159
-
160
-
161
-
162
-
163
-
164
-
165
-
166
-
167
-
168
-
169
-
170
-
171
-
172
-
173
-
174
-
175
-
176
-
177
-
178
-
179
-
180
-
181
-
182
-
183
-
184
-
185
-
186
-
187
-
188
-
189
-
190
-
191
-
192
-
193
-
194
-
195
-
196
-
197
-
198
-
199
-
200
-
201
-
202
-
203
-
204
-
205
-
206
-
207
-
208
-
209
-
210
-
211
-
212
-
213
-
214
-
215
-
216
-
217
-
218
-
219
-
220
-
221
-
222
-
223
-
224
-
225
-
226
-
227
-
228
-
229
-
230
-
231
-
232
-
233
-
234
-
235
-
236
-
237
-
238
-
239
-
240
-
241
-
242
-
243
-
244
-
245
-
246
-
247
-
248
-
249
-
250
-
251
-
252
-
253
-
254
-
255
-
256
-
257
-
258
-
259
-
260
-
261
-
262
-
263
-
264
-
265
-
266
-
267
-
268
-
269
-
270
-
271
-
272
-
273
-
274
-
275
-
276
-
277
-
278
-
279
-
280
-
281
-
282
-
283
-
284
-
285
-
286
-
287
-
288
-
289
-
290
-
291
-
292
-
293
-
294
-
295
-
296
-
297
-
298
-
299
-
300
-
301
-
302
-
303
-
304
-
305
-
306
-
307
-
308
-
309
-
310
-
311
 |
 |
rate risk due to differences in the timing between the maturities or repricing of assets and liabilities. For example,
if more assets are repricing than deposits and other borrowings when interest rates are declining, our earnings
will decrease. Similarly, if more deposits and other borrowings are repricing than assets when interest rates are
rising, our earnings will decrease. Interest rate risk also results from changes in customer behavior and
competitors’ responses to changes in interest rates or other market conditions. For example, decreases in
mortgage rates generally result in faster than expected prepayments, which may adversely affect earnings.
Increases in interest rates, coupled with strong demand from competitors for deposits, may influence industry
pricing. Such competition may affect customer decisions to maintain balances in the deposit accounts, which
may require replacing lower cost deposits with higher cost alternative sources of funding.
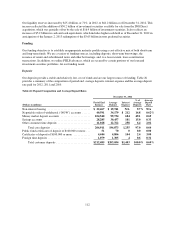
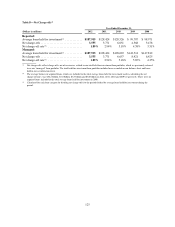
Foreign Exchange Risk
Foreign exchange risk represents exposure to changes in the values of current holdings and future cash flows
denominated in other currencies. The types of instruments exposed to this risk include investments in foreign
subsidiaries, foreign currency-denominated loans and securities, future cash flows in foreign currencies arising
from foreign exchange transactions, foreign currency-denominated debt and various foreign exchange derivative
instruments whose values fluctuate with changes in the level or volatility of currency exchange rates or foreign
interest rates.
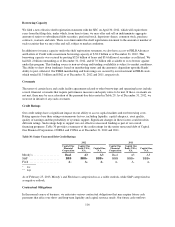
We are exposed to changes in foreign exchange rates, which may impact the earnings of our foreign operations.
We monitor and manage our material foreign currency denominated transactions and exposures through the use
of derivatives to limit our earnings sensitivity exposure to foreign exchange risk. The estimated reduction in our
12-month earnings due to adverse foreign exchange rate movements corresponding to a 95% probability was less
than 2.0% as of December 31, 2012 and 2011. The precision of this estimate is limited due to the inherent
uncertainty of the underlying forecast assumptions.
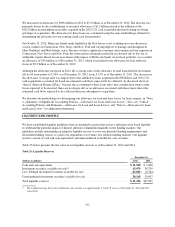
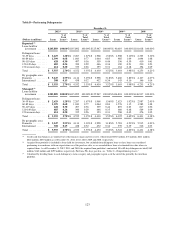
Market Risk Management
We employ several techniques to manage our interest rate and foreign currency risk, which include, but are not
limited to, changing the maturity and re-pricing characteristics of our various assets and liabilities. Derivatives
are one of the primary tools we use in managing interest rate and foreign exchange risk. We execute our
derivative contracts in both over-the-counter and exchange-traded derivative markets. Although the majority of
our derivatives are interest rate swaps, we also use a variety of other derivative instruments, including caps,
floors, options, futures and forward contracts, to manage our interest rate and foreign currency risk.
The outstanding notional amount of our derivative contracts decreased to $57.8 billion as of December 31, 2012,
from $73.2 billion as of December 31, 2011. The decrease in the notional amount of our derivative contracts was
primarily attributable to the termination of the ING Direct-related swap transactions that were executed to
manage the anticipated impact of the ING Direct acquisition on our market risk exposure and regulatory capital
requirements. From the date we entered into the agreement to acquire ING Direct to early August 2011, interest
rates declined substantially, which resulted in an increase in the estimated fair value of the ING Direct net assets
and liabilities. In order to capture some of the anticipated benefits to regulatory capital on the closing date
attributable to this decline in interest rates, we entered into various interest-rate swap transactions with a total
notional principal amount of approximately $24.8 billion. These combined swap transactions were intended to
mitigate the effect of a rise in interest rates on the fair values of a significant portion of the ING Direct assets and
liabilities during the period from when we entered into the swap transactions to the anticipated closing date of the
ING Direct acquisition in early 2012. In conjunction with our close of the ING Direct acquisition on February 17,
2012, we terminated the ING Direct-related swap transactions.
118