Capital One 2012 Annual Report Download - page 205
Download and view the complete annual report
Please find page 205 of the 2012 Capital One annual report below. You can navigate through the pages in the report by either clicking on the pages listed below, or by using the keyword search tool below to find specific information within the annual report.-
 1
1 -
2
-
3
-
4
-
5
-
6
-
7
-
8
-
9
-
10
-
11
-
12
-
13
-
14
-
15
-
16
-
17
-
18
-
19
-
20
-
21
-
22
-
23
-
24
-
25
-
26
-
27
-
28
-
29
-
30
-
31
-
32
-
33
-
34
-
35
-
36
-
37
-
38
-
39
-
40
-
41
-
42
-
43
-
44
-
45
-
46
-
47
-
48
-
49
-
50
-
51
-
52
-
53
-
54
-
55
-
56
-
57
-
58
-
59
-
60
-
61
-
62
-
63
-
64
-
65
-
66
-
67
-
68
-
69
-
70
-
71
-
72
-
73
-
74
-
75
-
76
-
77
-
78
-
79
-
80
-
81
-
82
-
83
-
84
-
85
-
86
-
87
-
88
-
89
-
90
-
91
-
92
-
93
-
94
-
95
-
96
-
97
-
98
-
99
-
100
-
101
-
102
-
103
-
104
-
105
-
106
-
107
-
108
-
109
-
110
-
111
-
112
-
113
-
114
-
115
-
116
-
117
-
118
-
119
-
120
-
121
-
122
-
123
-
124
-
125
-
126
-
127
-
128
-
129
-
130
-
131
-
132
-
133
-
134
-
135
-
136
-
137
-
138
-
139
-
140
-
141
-
142
-
143
-
144
-
145
-
146
-
147
-
148
-
149
-
150
-
151
-
152
-
153
-
154
-
155
-
156
-
157
-
158
-
159
-
160
-
161
-
162
-
163
-
164
-
165
-
166
-
167
-
168
-
169
-
170
-
171
-
172
-
173
-
174
-
175
-
176
-
177
-
178
-
179
-
180
-
181
-
182
-
183
-
184
-
185
-
186
-
187
-
188
-
189
-
190
-
191
-
192
-
193
-
194
-
 195
195 -
 196
196 -
 197
197 -
 198
198 -
 199
199 -
 200
200 -
 201
201 -
 202
202 -
 203
203 -
 204
204 -
 205
205 -
 206
206 -
 207
207 -
 208
208 -
 209
209 -
 210
210 -
 211
211 -
 212
212 -
 213
213 -
 214
214 -
 215
215 -
216
-
217
-
218
-
219
-
220
-
221
-
222
-
223
-
224
-
225
-
226
-
227
-
228
-
229
-
230
-
231
-
232
-
233
-
234
-
235
-
236
-
237
-
238
-
239
-
240
-
241
-
242
-
243
-
244
-
245
-
246
-
247
-
248
-
249
-
250
-
251
-
252
-
253
-
254
-
255
-
256
-
257
-
258
-
259
-
260
-
261
-
262
-
263
-
264
-
265
-
266
-
267
-
268
-
269
-
270
-
271
-
272
-
273
-
274
-
275
-
276
-
277
-
278
-
279
-
280
-
281
-
282
-
283
-
284
-
285
-
286
-
287
-
288
-
289
-
290
-
291
-
292
-
293
-
294
-
295
-
296
-
297
-
298
-
299
-
300
-
301
-
302
-
303
-
304
-
305
-
306
-
307
-
308
-
309
-
310
-
311
 |
 |

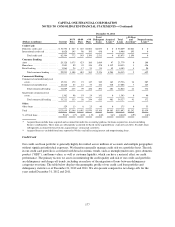
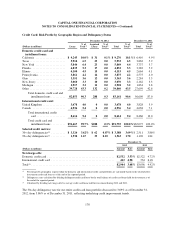
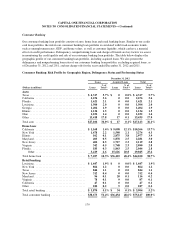
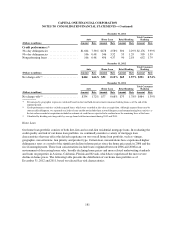
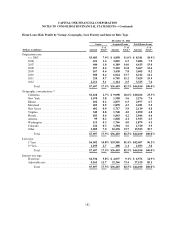
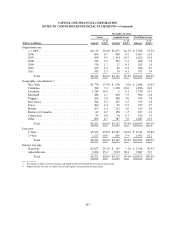
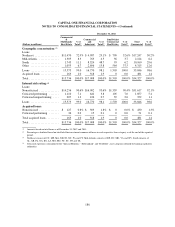
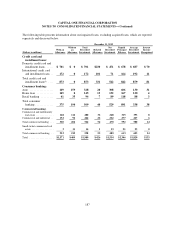
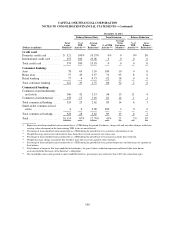
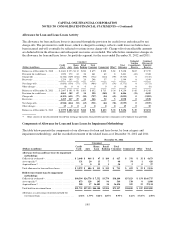
CAPITAL ONE FINANCIAL CORPORATION
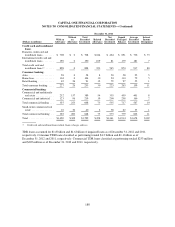
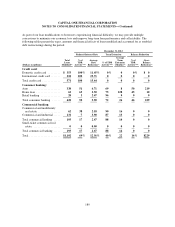
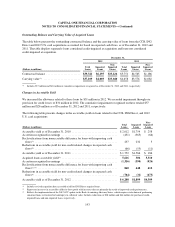
NOTES TO CONSOLIDATED FINANCIAL STATEMENTS—(Continued)
December 31, 2011
(Dollars in millions)
Commercial
&
Multifamily
Real Estate
% of
Total(2)
Commercial
and
Industrial
% of
Total(2)
Small-ticket
Commercial
Real Estate
% of
Total(2)
Total
Commercial
% of
Total(2)
Geographic concentration:(3)
Loans:
Northeast ................. $11,470 72.9% $ 4,987 29.1% $ 790 52.6% $17,247 50.2%
Mid-Atlantic .............. 1,305 8.3 763 4.5 56 3.7 2,124 6.2
South .................... 1,743 11.1 8,324 48.7 93 6.2 10,160 29.6
Other .................... 1,055 6.7 2,696 15.8 564 37.5 4,315 12.6
Loans .................... 15,573 99.0 16,770 98.1 1,503 100.0 33,846 98.6
Acquired loans . . . . . . . . . . . . . 163 1.0 318 1.9 0 0.0 481 1.4
Total ..................... $15,736 100.0% $17,088 100.0% $1,503 100.0% $34,327 100.0%
Internal risk rating:(4)
Loans:
Noncriticized .............. $14,256 90.6% $16,002 93.6% $1,359 90.4% $31,617 92.1%
Criticized performing ....... 1,110 7.1 642 3.8 105 7.0 1,857 5.4
Criticized nonperforming . . . . 207 1.3 126 0.7 39 2.6 372 1.1
Loans .................... 15,573 99.0 16,770 98.1 1,503 100.0 33,846 98.6
Acquired loans:
Noncriticized .............. $ 127 0.8% $ 303 1.8% $ 0 0.0% $ 430 1.3%
Criticized performing . . . . . . . 36 0.2 15 0.1 0 0.0 51 0.1
Total acquired loans . . . . . . . . . 163 1.0 318 1.9 0 0.0 481 1.4
Total ..................... $15,736 100.0% $17,088 100.0% $1,503 100.0% $34,327 100.0%
(1) Amounts based on total loans as of December 31, 2012 and 2011.
(2) Percentages calculated based on total held-for-investment commercial loans in each respective loan category as of the end of the reported
period.
(3) Northeast consists of CT, ME, MA, NH, NJ, NY, PA and VT. Mid-Atlantic consists of DE, DC, MD, VA and WV. South consists of
AL, AR, FL, GA, KY, LA, MS, MO, NC, SC, TN and TX.
(4) Criticized exposures correspond to the “Special Mention,” “Substandard” and “Doubtful” asset categories defined by banking regulatory
authorities.
186