Capital One 2012 Annual Report Download - page 201
Download and view the complete annual report
Please find page 201 of the 2012 Capital One annual report below. You can navigate through the pages in the report by either clicking on the pages listed below, or by using the keyword search tool below to find specific information within the annual report.-
 1
1 -
2
-
3
-
4
-
5
-
6
-
7
-
8
-
9
-
10
-
11
-
12
-
13
-
14
-
15
-
16
-
17
-
18
-
19
-
20
-
21
-
22
-
23
-
24
-
25
-
26
-
27
-
28
-
29
-
30
-
31
-
32
-
33
-
34
-
35
-
36
-
37
-
38
-
39
-
40
-
41
-
42
-
43
-
44
-
45
-
46
-
47
-
48
-
49
-
50
-
51
-
52
-
53
-
54
-
55
-
56
-
57
-
58
-
59
-
60
-
61
-
62
-
63
-
64
-
65
-
66
-
67
-
68
-
69
-
70
-
71
-
72
-
73
-
74
-
75
-
76
-
77
-
78
-
79
-
80
-
81
-
82
-
83
-
84
-
85
-
86
-
87
-
88
-
89
-
90
-
91
-
92
-
93
-
94
-
95
-
96
-
97
-
98
-
99
-
100
-
101
-
102
-
103
-
104
-
105
-
106
-
107
-
108
-
109
-
110
-
111
-
112
-
113
-
114
-
115
-
116
-
117
-
118
-
119
-
120
-
121
-
122
-
123
-
124
-
125
-
126
-
127
-
128
-
129
-
130
-
131
-
132
-
133
-
134
-
135
-
136
-
137
-
138
-
139
-
140
-
141
-
142
-
143
-
144
-
145
-
146
-
147
-
148
-
149
-
150
-
151
-
152
-
153
-
154
-
155
-
156
-
157
-
158
-
159
-
160
-
161
-
162
-
163
-
164
-
165
-
166
-
167
-
168
-
169
-
170
-
171
-
172
-
173
-
174
-
175
-
176
-
177
-
178
-
179
-
180
-
181
-
182
-
183
-
184
-
185
-
186
-
187
-
188
-
189
-
190
-
 191
191 -
 192
192 -
 193
193 -
 194
194 -
 195
195 -
 196
196 -
 197
197 -
 198
198 -
 199
199 -
 200
200 -
 201
201 -
 202
202 -
 203
203 -
 204
204 -
 205
205 -
 206
206 -
 207
207 -
 208
208 -
 209
209 -
 210
210 -
 211
211 -
212
-
213
-
214
-
215
-
216
-
217
-
218
-
219
-
220
-
221
-
222
-
223
-
224
-
225
-
226
-
227
-
228
-
229
-
230
-
231
-
232
-
233
-
234
-
235
-
236
-
237
-
238
-
239
-
240
-
241
-
242
-
243
-
244
-
245
-
246
-
247
-
248
-
249
-
250
-
251
-
252
-
253
-
254
-
255
-
256
-
257
-
258
-
259
-
260
-
261
-
262
-
263
-
264
-
265
-
266
-
267
-
268
-
269
-
270
-
271
-
272
-
273
-
274
-
275
-
276
-
277
-
278
-
279
-
280
-
281
-
282
-
283
-
284
-
285
-
286
-
287
-
288
-
289
-
290
-
291
-
292
-
293
-
294
-
295
-
296
-
297
-
298
-
299
-
300
-
301
-
302
-
303
-
304
-
305
-
306
-
307
-
308
-
309
-
310
-
311
 |
 |

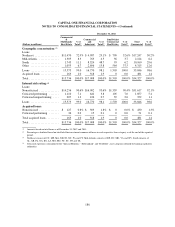
CAPITAL ONE FINANCIAL CORPORATION
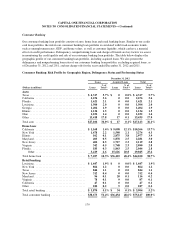
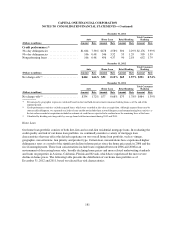
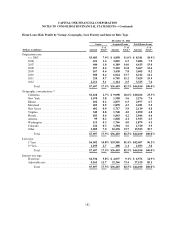
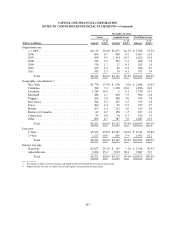
NOTES TO CONSOLIDATED FINANCIAL STATEMENTS—(Continued)
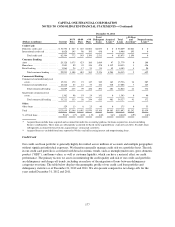
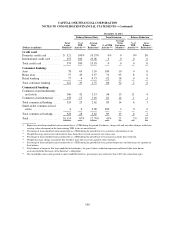
Home Loan: Risk Profile by Vintage, Geography, Lien Priority and Interest Rate Type
December 31, 2012
Loans Acquired Loans Total Home Loans
(Dollars in millions) Amount
% of
Total(1) Amount
% of
Total(1) Amount
% of
Total(1)
Origination year:
< = 2005 ................................. $3,483 7.9% $ 4,858 11.0% $ 8,341 18.9%
2006 .................................... 621 1.4 2,865 6.5 3,486 7.9
2007 .................................... 446 1.0 6,189 14.0 6,635 15.0
2008 .................................... 257 0.6 5,210 11.8 5,467 12.4
2009 .................................... 167 0.4 3,438 7.8 3,605 8.2
2010 .................................... 188 0.4 6,024 13.7 6,212 14.1
2011 .................................... 324 0.7 6,705 15.2 7,029 15.9
2012 .................................... 2,211 5.1 1,114 2.5 3,325 7.6
Total ................................ $7,697 17.5% $36,403 82.5% $44,100 100.0%
Geographic concentration:(2)
California ................................ $1,168 2.7% $ 9,098 20.6% $10,266 23.3%
New York ................................ 1,678 3.8 1,598 3.6 3,276 7.4
Illinois ................................... 102 0.2 2,875 6.5 2,977 6.7
Maryland ................................. 403 0.9 1,878 4.3 2,281 5.2
New Jersey ............................... 402 0.9 1,717 3.9 2,119 4.8
Virginia .................................. 342 0.8 1,748 4.0 2,090 4.8
Florida ................................... 183 0.4 1,863 4.2 2,046 4.6
Arizona .................................. 95 0.2 1,828 4.1 1,923 4.3
Washington ............................... 113 0.3 1,766 4.0 1,879 4.3
Colorado ................................. 126 0.3 1,594 3.6 1,720 3.9
Other .................................... 3,085 7.0 10,438 23.7 13,523 30.7
Total ................................ $7,697 17.5% $36,403 82.5% $44,100 100.0%
Lien type:
1st lien ................................... $6,502 14.8% $35,905 81.4% $42,407 96.2%
2nd lien ................................... 1,195 2.7 498 1.1 1,693 3.8
Total ................................ $7,697 17.5% $36,403 82.5% $44,100 100.0%
Interest rate type:
Fixed rate ................................ $2,534 5.8% $ 4,037 9.1% $ 6,571 14.9%
Adjustable rate ............................ 5,163 11.7 32,366 73.4 37,529 85.1
Total ................................ $7,697 17.5% $36,403 82.5% $44,100 100.0%
182