Capital One 2012 Annual Report Download - page 71
Download and view the complete annual report
Please find page 71 of the 2012 Capital One annual report below. You can navigate through the pages in the report by either clicking on the pages listed below, or by using the keyword search tool below to find specific information within the annual report.-
 1
1 -
2
-
3
-
4
-
5
-
6
-
7
-
8
-
9
-
10
-
11
-
12
-
13
-
14
-
15
-
16
-
17
-
18
-
19
-
20
-
21
-
22
-
23
-
24
-
25
-
26
-
27
-
28
-
29
-
30
-
31
-
32
-
33
-
34
-
35
-
36
-
37
-
38
-
39
-
40
-
41
-
42
-
43
-
44
-
45
-
46
-
47
-
48
-
49
-
50
-
51
-
52
-
53
-
54
-
55
-
56
-
57
-
58
-
59
-
60
-
 61
61 -
 62
62 -
 63
63 -
 64
64 -
 65
65 -
 66
66 -
 67
67 -
 68
68 -
 69
69 -
 70
70 -
 71
71 -
 72
72 -
 73
73 -
 74
74 -
 75
75 -
 76
76 -
 77
77 -
 78
78 -
 79
79 -
 80
80 -
 81
81 -
82
-
83
-
84
-
85
-
86
-
87
-
88
-
89
-
90
-
91
-
92
-
93
-
94
-
95
-
96
-
97
-
98
-
99
-
100
-
101
-
102
-
103
-
104
-
105
-
106
-
107
-
108
-
109
-
110
-
111
-
112
-
113
-
114
-
115
-
116
-
117
-
118
-
119
-
120
-
121
-
122
-
123
-
124
-
125
-
126
-
127
-
128
-
129
-
130
-
131
-
132
-
133
-
134
-
135
-
136
-
137
-
138
-
139
-
140
-
141
-
142
-
143
-
144
-
145
-
146
-
147
-
148
-
149
-
150
-
151
-
152
-
153
-
154
-
155
-
156
-
157
-
158
-
159
-
160
-
161
-
162
-
163
-
164
-
165
-
166
-
167
-
168
-
169
-
170
-
171
-
172
-
173
-
174
-
175
-
176
-
177
-
178
-
179
-
180
-
181
-
182
-
183
-
184
-
185
-
186
-
187
-
188
-
189
-
190
-
191
-
192
-
193
-
194
-
195
-
196
-
197
-
198
-
199
-
200
-
201
-
202
-
203
-
204
-
205
-
206
-
207
-
208
-
209
-
210
-
211
-
212
-
213
-
214
-
215
-
216
-
217
-
218
-
219
-
220
-
221
-
222
-
223
-
224
-
225
-
226
-
227
-
228
-
229
-
230
-
231
-
232
-
233
-
234
-
235
-
236
-
237
-
238
-
239
-
240
-
241
-
242
-
243
-
244
-
245
-
246
-
247
-
248
-
249
-
250
-
251
-
252
-
253
-
254
-
255
-
256
-
257
-
258
-
259
-
260
-
261
-
262
-
263
-
264
-
265
-
266
-
267
-
268
-
269
-
270
-
271
-
272
-
273
-
274
-
275
-
276
-
277
-
278
-
279
-
280
-
281
-
282
-
283
-
284
-
285
-
286
-
287
-
288
-
289
-
290
-
291
-
292
-
293
-
294
-
295
-
296
-
297
-
298
-
299
-
300
-
301
-
302
-
303
-
304
-
305
-
306
-
307
-
308
-
309
-
310
-
311
 |
 |
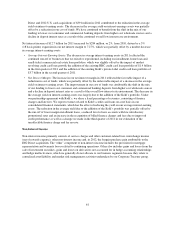
industry to which the issuer belongs; the payment structure of the security; external credit ratings; the value of
underlying collateral and current market conditions. Quantitative criteria include assessing whether there has
been an adverse change in expected future cash flows. See “Note 4—Investment Securities” for additional
information.
Goodwill and Other Intangible Assets
As a result of our acquisitions, including Hibernia Corporation in 2005, North Fork Bancorporation in 2006,
Chevy Chase Bank in 2009, and the 2012 U.S. card acquisition we have goodwill and other intangible assets.
Goodwill resulting from business combinations prior to January 1, 2009 represents the excess of the purchase
price over the fair value of the net assets of businesses acquired. Goodwill resulting from business combinations
after January 1, 2009, is generally determined as the excess of the fair value of the consideration transferred, plus
the fair value of any noncontrolling interests in the acquiree, over the fair value of the net assets acquired and
liabilities assumed as of the acquisition date.
Goodwill totaled $13.9 billion and $13.6 billion as of December 31, 2012 and 2011, respectively. Other
intangible assets, which we report on our consolidated balance sheets as a component of other assets, consist
primarily of PCCR and core deposit intangibles. The net carrying value of other intangible assets increased to
$2.6 billion as of December 31, 2012, from $610 million as of December 31, 2011. The increase was primarily
due to the PCCR intangible of $2.2 billion recorded in connection with the 2012 U.S. card acquisition on May 1,
2012. Goodwill and other intangible assets together represented 5% and 7% of our total assets as of
December 31, 2012 and 2011, respectively.
Goodwill
Goodwill is not amortized but must be allocated to reporting units and tested for impairment on an annual basis
or in interim periods if events or circumstances indicate potential impairment. A reporting unit is a business
segment or one level below. Our reporting units for purposes of goodwill impairment testing are Domestic Card,
International Card, Auto Finance, other Consumer Banking and Commercial Banking. We perform our annual
goodwill impairment test for all reporting units as of October 1 each year using a two-step process. First, we
compare the fair value of each reporting unit to its current carrying amount, including goodwill. If the fair value
of the reporting unit is in excess of the carrying value, the related goodwill is considered not to be impaired and
no further analysis is necessary. If, however, the carrying value of the reporting unit exceeds the fair value, there
is an indication of potential impairment and a second step of testing is performed to measure the amount of
impairment, if any, for that reporting unit.
We do not maintain separate balance sheets at the reporting unit level; therefore, we determine the carrying
values of our reporting units based on an economic capital approach, in which we calculate each reporting unit’s
capital requirements based on the individual reporting units’ capital allocation rates applied to their outstanding
loans and deposits plus specifically assigned goodwill and intangible assets. The capital allocation rates are
approved by our Chief Executive Officer and executive team on an annual basis and are based on our current
regulatory requirements and reporting unit specific risks and capital structures. The economic capital approach
appropriately reflects the carrying value of each our reporting units based on the capital allocated to and managed
at each of those reporting units. We compare the total reporting unit carrying values to our total consolidated
stockholders’ equity, as discussed further in “Note 8—Goodwill and Other Intangible Assets,” to assess the
appropriateness of our methodology. If the second step of goodwill impairment testing is required for a reporting
unit, we undertake an extensive effort to build the specific reporting unit’s balance sheet for the test based on
applicable accounting guidance.
Estimating the fair value of reporting units and the assets, liabilities and intangible assets of a reporting unit is a
subjective process that involves the use of estimates and judgments, particularly related to cash flows, the
appropriate discount rates and an applicable control premium. Management judgment is required to assess
52