Capital One 2012 Annual Report Download - page 239
Download and view the complete annual report
Please find page 239 of the 2012 Capital One annual report below. You can navigate through the pages in the report by either clicking on the pages listed below, or by using the keyword search tool below to find specific information within the annual report.-
 1
1 -
2
-
3
-
4
-
5
-
6
-
7
-
8
-
9
-
10
-
11
-
12
-
13
-
14
-
15
-
16
-
17
-
18
-
19
-
20
-
21
-
22
-
23
-
24
-
25
-
26
-
27
-
28
-
29
-
30
-
31
-
32
-
33
-
34
-
35
-
36
-
37
-
38
-
39
-
40
-
41
-
42
-
43
-
44
-
45
-
46
-
47
-
48
-
49
-
50
-
51
-
52
-
53
-
54
-
55
-
56
-
57
-
58
-
59
-
60
-
61
-
62
-
63
-
64
-
65
-
66
-
67
-
68
-
69
-
70
-
71
-
72
-
73
-
74
-
75
-
76
-
77
-
78
-
79
-
80
-
81
-
82
-
83
-
84
-
85
-
86
-
87
-
88
-
89
-
90
-
91
-
92
-
93
-
94
-
95
-
96
-
97
-
98
-
99
-
100
-
101
-
102
-
103
-
104
-
105
-
106
-
107
-
108
-
109
-
110
-
111
-
112
-
113
-
114
-
115
-
116
-
117
-
118
-
119
-
120
-
121
-
122
-
123
-
124
-
125
-
126
-
127
-
128
-
129
-
130
-
131
-
132
-
133
-
134
-
135
-
136
-
137
-
138
-
139
-
140
-
141
-
142
-
143
-
144
-
145
-
146
-
147
-
148
-
149
-
150
-
151
-
152
-
153
-
154
-
155
-
156
-
157
-
158
-
159
-
160
-
161
-
162
-
163
-
164
-
165
-
166
-
167
-
168
-
169
-
170
-
171
-
172
-
173
-
174
-
175
-
176
-
177
-
178
-
179
-
180
-
181
-
182
-
183
-
184
-
185
-
186
-
187
-
188
-
189
-
190
-
191
-
192
-
193
-
194
-
195
-
196
-
197
-
198
-
199
-
200
-
201
-
202
-
203
-
204
-
205
-
206
-
207
-
208
-
209
-
210
-
211
-
212
-
213
-
214
-
215
-
216
-
217
-
218
-
219
-
220
-
221
-
222
-
223
-
224
-
225
-
226
-
227
-
228
-
 229
229 -
 230
230 -
 231
231 -
 232
232 -
 233
233 -
 234
234 -
 235
235 -
 236
236 -
 237
237 -
 238
238 -
 239
239 -
 240
240 -
 241
241 -
 242
242 -
 243
243 -
 244
244 -
 245
245 -
 246
246 -
 247
247 -
 248
248 -
 249
249 -
250
-
251
-
252
-
253
-
254
-
255
-
256
-
257
-
258
-
259
-
260
-
261
-
262
-
263
-
264
-
265
-
266
-
267
-
268
-
269
-
270
-
271
-
272
-
273
-
274
-
275
-
276
-
277
-
278
-
279
-
280
-
281
-
282
-
283
-
284
-
285
-
286
-
287
-
288
-
289
-
290
-
291
-
292
-
293
-
294
-
295
-
296
-
297
-
298
-
299
-
300
-
301
-
302
-
303
-
304
-
305
-
306
-
307
-
308
-
309
-
310
-
311
 |
 |

CAPITAL ONE FINANCIAL CORPORATION
NOTES TO CONSOLIDATED FINANCIAL STATEMENTS—(Continued)
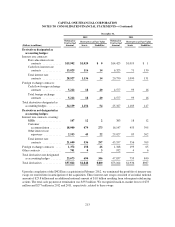
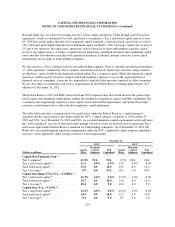
(1) Calculated under capital standards and regulations based on the international capital framework commonly known as Basel I. Capital
ratios that are not applicable are denoted by “N/A.”
(2) The regulatory framework for prompt corrective action does not apply to Capital One Financial Corp. because it is a bank holding
company.
(3) Tier 1 common ratio is a regulatory capital measure calculated based on Tier 1 common capital divided by risk-weighted assets.
(4) Tier 1 risk-based capital ratio is a regulatory capital measure calculated based on Tier 1 capital divided by risk-weighted assets.
(5) Total risk-based capital ratio is a regulatory capital measure calculated based on total risk-based capital divided by risk-weighted assets.
(6) Tier 1 leverage ratio is calculated based on Tier 1 capital divided by quarterly average total assets, after certain adjustments.
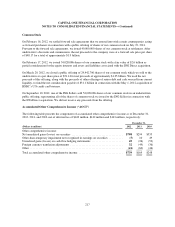
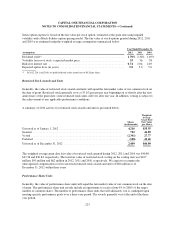
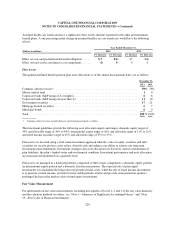
On October 17, 2012, the OCC approved, subject to several conditions, CONA’s application to merge with ING
Bank with CONA surviving the merger. Capital One effected the merger on November 1, 2012. In addition, the
OCC approved CONA’s companion application to reduce capital surplus, which was necessary to manage excess
capital levels that would result from the merger. CONA effected the reduction in surplus through a return of
capital to Capital One immediately prior to the merger. The merger and reduction in CONA’s capital surplus had
no effect on Capital One’s total capital.
Regulatory restrictions exist that limit the ability of the Banks to transfer funds to our bank holding
company. Funds available for dividend payments from COBNA and CONA were $3.3 billion and $1.9 billion,
respectively, as of December 31, 2012. Applicable provisions that may be contained in our borrowing
agreements or the borrowing agreements of our subsidiaries may limit our subsidiaries’ ability to pay dividends
to us or our ability to pay dividends to our stockholders. There can be no assurance that we will declare and pay
any dividends.
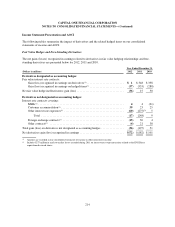
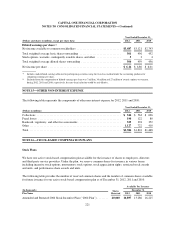
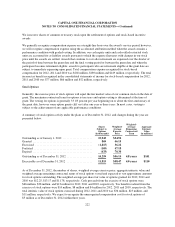
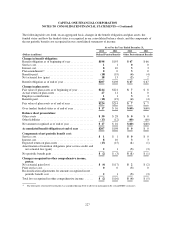
NOTE 14—EARNINGS PER COMMON SHARE
The following table sets forth the computation of basic and diluted earnings per common share:
Year Ended December 31,
(Dollars and shares in millions, except per share data) 2012 2011 2010
Basic earnings per share
Income from continuing operations, net of tax ............................... $3,734 $3,253 $3,050
Loss from discontinued operations, net of tax ................................ (217) (106) (307)
Net income ........................................................... 3,517 3,147 2,743
Dividends and undistributed earnings allocated to participating securities(1) ........ (15) (26) 0
Preferred stock dividends ................................................ (15) 00
Net income available to common stockholders ............................... $3,487 $3,121 $2,743
Total weighted-average basic shares outstanding ............................. 561 456 452
Net income per share ................................................... $ 6.21 $ 6.85 $ 6.07
220