Capital One 2012 Annual Report Download - page 246
Download and view the complete annual report
Please find page 246 of the 2012 Capital One annual report below. You can navigate through the pages in the report by either clicking on the pages listed below, or by using the keyword search tool below to find specific information within the annual report.-
 1
1 -
2
-
3
-
4
-
5
-
6
-
7
-
8
-
9
-
10
-
11
-
12
-
13
-
14
-
15
-
16
-
17
-
18
-
19
-
20
-
21
-
22
-
23
-
24
-
25
-
26
-
27
-
28
-
29
-
30
-
31
-
32
-
33
-
34
-
35
-
36
-
37
-
38
-
39
-
40
-
41
-
42
-
43
-
44
-
45
-
46
-
47
-
48
-
49
-
50
-
51
-
52
-
53
-
54
-
55
-
56
-
57
-
58
-
59
-
60
-
61
-
62
-
63
-
64
-
65
-
66
-
67
-
68
-
69
-
70
-
71
-
72
-
73
-
74
-
75
-
76
-
77
-
78
-
79
-
80
-
81
-
82
-
83
-
84
-
85
-
86
-
87
-
88
-
89
-
90
-
91
-
92
-
93
-
94
-
95
-
96
-
97
-
98
-
99
-
100
-
101
-
102
-
103
-
104
-
105
-
106
-
107
-
108
-
109
-
110
-
111
-
112
-
113
-
114
-
115
-
116
-
117
-
118
-
119
-
120
-
121
-
122
-
123
-
124
-
125
-
126
-
127
-
128
-
129
-
130
-
131
-
132
-
133
-
134
-
135
-
136
-
137
-
138
-
139
-
140
-
141
-
142
-
143
-
144
-
145
-
146
-
147
-
148
-
149
-
150
-
151
-
152
-
153
-
154
-
155
-
156
-
157
-
158
-
159
-
160
-
161
-
162
-
163
-
164
-
165
-
166
-
167
-
168
-
169
-
170
-
171
-
172
-
173
-
174
-
175
-
176
-
177
-
178
-
179
-
180
-
181
-
182
-
183
-
184
-
185
-
186
-
187
-
188
-
189
-
190
-
191
-
192
-
193
-
194
-
195
-
196
-
197
-
198
-
199
-
200
-
201
-
202
-
203
-
204
-
205
-
206
-
207
-
208
-
209
-
210
-
211
-
212
-
213
-
214
-
215
-
216
-
217
-
218
-
219
-
220
-
221
-
222
-
223
-
224
-
225
-
226
-
227
-
228
-
229
-
230
-
231
-
232
-
233
-
234
-
235
-
 236
236 -
 237
237 -
 238
238 -
 239
239 -
 240
240 -
 241
241 -
 242
242 -
 243
243 -
 244
244 -
 245
245 -
 246
246 -
 247
247 -
 248
248 -
 249
249 -
 250
250 -
 251
251 -
 252
252 -
 253
253 -
 254
254 -
 255
255 -
 256
256 -
257
-
258
-
259
-
260
-
261
-
262
-
263
-
264
-
265
-
266
-
267
-
268
-
269
-
270
-
271
-
272
-
273
-
274
-
275
-
276
-
277
-
278
-
279
-
280
-
281
-
282
-
283
-
284
-
285
-
286
-
287
-
288
-
289
-
290
-
291
-
292
-
293
-
294
-
295
-
296
-
297
-
298
-
299
-
300
-
301
-
302
-
303
-
304
-
305
-
306
-
307
-
308
-
309
-
310
-
311
 |
 |

CAPITAL ONE FINANCIAL CORPORATION
NOTES TO CONSOLIDATED FINANCIAL STATEMENTS—(Continued)
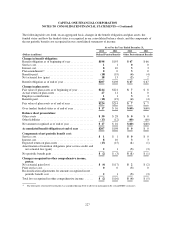
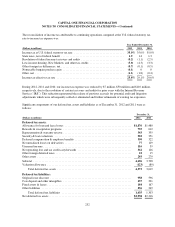
The following table sets forth, on an aggregated basis, changes in the benefit obligation and plan assets, the
funded status and how the funded status is recognized in our consolidated balance sheets, and the components of
the net periodic benefit cost recognized in our consolidated statements of income:
At or For the Year Ended December 31,
2012 2011 2012 2011
(Dollars in millions) Defined Pension Benefits Other Postretirement Benefits
Change in benefit obligation:
Benefit obligation as of beginning of year ................ $198 $193 $ 67 $ 66
Service cost ....................................... 1100
Interest cost ....................................... 810 33
Plan amendments(1) ................................. 0030
Benefits paid ....................................... (18) (19) (4) (4)
Net actuarial loss (gain) .............................. 18 13 (2) 2
Benefit obligation as of end of year ..................... $207 $198 $ 67 $ 67
Change in plan assets:
Fair value of plan assets as of beginning of year ........... $214 $221 $7 $8
Actual return on plan assets ........................... 27 11 10
Employer contributions .............................. 1133
Benefits paid ....................................... (18) (19) (4) (4)
Fair value of plan assets as of end of year ................ $224 $214 $7 $7
Over (under) funded status as of end of year .............. $ 17 $ 16 $(60) $(60)
Balance sheet presentation:
Other assets ....................................... $ 30 $ 28 $0 $0
Other liabilities ..................................... (13) (12) (60) (60)
Net amount recognized as of end of year ................. $ 17 $ 16 $(60) $(60)
Accumulated benefit obligation at end of year .......... $207 $198 $0 $0
Components of net periodic benefit cost:
Service cost ....................................... $1 $1 $0 $0
Interest cost ....................................... 810 33
Expected return on plan assets ......................... (13) (15) (1) (1)
Amortization of transition obligation, prior service credit, and
net actuarial loss (gain) ............................ 21(3) (3)
Net periodic benefit gain ............................. $ (2) $ (3) $ (1) $ (1)
Changes recognized in other comprehensive income,
pretax:
Net actuarial gain (loss) .............................. $ (4) $ (17) $2 $ (2)
Prior service cost ................................... 00(3) 0
Reclassification adjustments for amounts recognized in net
periodic benefit cost ............................... 21(3) (3)
Total loss recognized in other comprehensive income ...... $ (2) $ (16) $ (4) $ (5)
(1) The other post retirement benefit plan was amended during 2012 to allow for participation by certain HSBC associates.
227