Capital One 2012 Annual Report Download - page 212
Download and view the complete annual report
Please find page 212 of the 2012 Capital One annual report below. You can navigate through the pages in the report by either clicking on the pages listed below, or by using the keyword search tool below to find specific information within the annual report.-
 1
1 -
2
-
3
-
4
-
5
-
6
-
7
-
8
-
9
-
10
-
11
-
12
-
13
-
14
-
15
-
16
-
17
-
18
-
19
-
20
-
21
-
22
-
23
-
24
-
25
-
26
-
27
-
28
-
29
-
30
-
31
-
32
-
33
-
34
-
35
-
36
-
37
-
38
-
39
-
40
-
41
-
42
-
43
-
44
-
45
-
46
-
47
-
48
-
49
-
50
-
51
-
52
-
53
-
54
-
55
-
56
-
57
-
58
-
59
-
60
-
61
-
62
-
63
-
64
-
65
-
66
-
67
-
68
-
69
-
70
-
71
-
72
-
73
-
74
-
75
-
76
-
77
-
78
-
79
-
80
-
81
-
82
-
83
-
84
-
85
-
86
-
87
-
88
-
89
-
90
-
91
-
92
-
93
-
94
-
95
-
96
-
97
-
98
-
99
-
100
-
101
-
102
-
103
-
104
-
105
-
106
-
107
-
108
-
109
-
110
-
111
-
112
-
113
-
114
-
115
-
116
-
117
-
118
-
119
-
120
-
121
-
122
-
123
-
124
-
125
-
126
-
127
-
128
-
129
-
130
-
131
-
132
-
133
-
134
-
135
-
136
-
137
-
138
-
139
-
140
-
141
-
142
-
143
-
144
-
145
-
146
-
147
-
148
-
149
-
150
-
151
-
152
-
153
-
154
-
155
-
156
-
157
-
158
-
159
-
160
-
161
-
162
-
163
-
164
-
165
-
166
-
167
-
168
-
169
-
170
-
171
-
172
-
173
-
174
-
175
-
176
-
177
-
178
-
179
-
180
-
181
-
182
-
183
-
184
-
185
-
186
-
187
-
188
-
189
-
190
-
191
-
192
-
193
-
194
-
195
-
196
-
197
-
198
-
199
-
200
-
201
-
 202
202 -
 203
203 -
 204
204 -
 205
205 -
 206
206 -
 207
207 -
 208
208 -
 209
209 -
 210
210 -
 211
211 -
 212
212 -
 213
213 -
 214
214 -
 215
215 -
 216
216 -
 217
217 -
 218
218 -
 219
219 -
 220
220 -
 221
221 -
 222
222 -
223
-
224
-
225
-
226
-
227
-
228
-
229
-
230
-
231
-
232
-
233
-
234
-
235
-
236
-
237
-
238
-
239
-
240
-
241
-
242
-
243
-
244
-
245
-
246
-
247
-
248
-
249
-
250
-
251
-
252
-
253
-
254
-
255
-
256
-
257
-
258
-
259
-
260
-
261
-
262
-
263
-
264
-
265
-
266
-
267
-
268
-
269
-
270
-
271
-
272
-
273
-
274
-
275
-
276
-
277
-
278
-
279
-
280
-
281
-
282
-
283
-
284
-
285
-
286
-
287
-
288
-
289
-
290
-
291
-
292
-
293
-
294
-
295
-
296
-
297
-
298
-
299
-
300
-
301
-
302
-
303
-
304
-
305
-
306
-
307
-
308
-
309
-
310
-
311
 |
 |

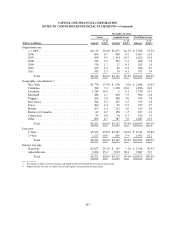
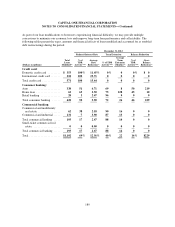
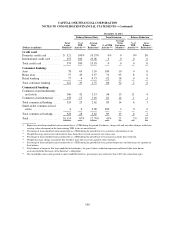
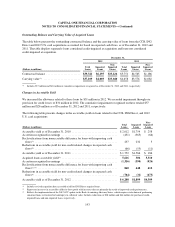
CAPITAL ONE FINANCIAL CORPORATION
NOTES TO CONSOLIDATED FINANCIAL STATEMENTS—(Continued)
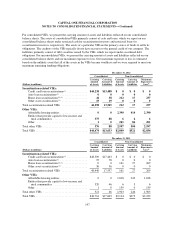
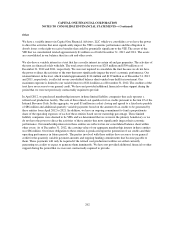
Outstanding Balance and Carrying Value of Acquired Loans
The table below presents the outstanding contractual balance and the carrying value of loans from the CCB, ING
Direct and 2012 U.S. card acquisitions accounted for based on expected cash flows, as of December 31, 2012 and
2011. The table displays separately loans considered credit-impaired at acquisition and loans not considered
credit-impaired at acquisition.
December 31,
2012 2011
(Dollars in millions)
Total
Loans
Impaired
Loans
Non-
Impaired
Loans
Total
Loans
Impaired
Loans
Non-
Impaired
Loans
Contractual balance ........................ $39,321 $6,195 $33,126 $5,751 $4,565 $1,186
Carrying value(1) .......................... $37,109 $4,069 $33,040 $4,658 $3,576 $1,082
(1) Includes $57 million and $26 million of cumulative impairment recognized as of December 31, 2012 and 2011, respectively.
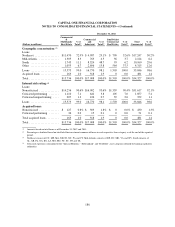
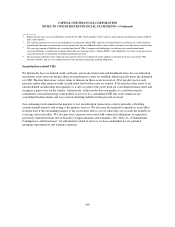
Changes in Accretable Yield
We increased the allowance related to these loans by $31 million in 2012. We recorded impairment through our
provision for credit losses of $31 million in 2012. The cumulative impairment recognized on these totaled $57
million and $26 million as of December 31, 2012 and 2011, respectively.
The following table presents changes in the accretable yield on loans related to the CCB, ING Direct, and 2012
U.S. card acquisitions:
(Dollars in millions)
Total
Loans
Impaired
Loans
Non-
Impaired
Loans
Accretable yield as of December 31, 2010 ................................ $2,012 $1,754 $ 258
Accretion recognized in earnings ....................................... (431) (365) (66)
Reclassifications from nonaccretable difference for loans with improving cash
flows(1) .......................................................... 237 232 5
Reductions in accretable yield for non-credit related changes in expected cash
flows(4) .......................................................... (66) (55) (11)
Accretable yield as of December 31, 2011 ................................ $1,752 $1,566 $ 186
Acquired loans accretable yield(1) ....................................... 5,616 306 5,310
Accretion recognized in earnings ....................................... (1,316) (390) (926)
Reclassifications from nonaccretable difference for loans with improving cash
flows(2) (3) ........................................................ 860 448 412
Reductions in accretable yield for non-credit related changes in expected cash
flows(4) .......................................................... (704) (31) (673)
Accretable yield as of December 31, 2012 ................................ $ 6,208 $1,899 $4,309
(1) Includes revised acquisition date accretable yield for ING Direct acquired loans.
(2) Represents increases in accretable yields for those pools with increases that are primarily the result of improved credit performance.
(3) Reflects the implementation of the 2012 OCC update to the Bank Accounting Advisory Series, which requires write-down of performing
consumer loans restructured in bankruptcy to collateral value. Includes reductions of $28 million and $44 million for purchased credit-
impaired loans and non-impaired loans, respectively.
193