Capital One 2012 Annual Report Download - page 241
Download and view the complete annual report
Please find page 241 of the 2012 Capital One annual report below. You can navigate through the pages in the report by either clicking on the pages listed below, or by using the keyword search tool below to find specific information within the annual report.-
 1
1 -
2
-
3
-
4
-
5
-
6
-
7
-
8
-
9
-
10
-
11
-
12
-
13
-
14
-
15
-
16
-
17
-
18
-
19
-
20
-
21
-
22
-
23
-
24
-
25
-
26
-
27
-
28
-
29
-
30
-
31
-
32
-
33
-
34
-
35
-
36
-
37
-
38
-
39
-
40
-
41
-
42
-
43
-
44
-
45
-
46
-
47
-
48
-
49
-
50
-
51
-
52
-
53
-
54
-
55
-
56
-
57
-
58
-
59
-
60
-
61
-
62
-
63
-
64
-
65
-
66
-
67
-
68
-
69
-
70
-
71
-
72
-
73
-
74
-
75
-
76
-
77
-
78
-
79
-
80
-
81
-
82
-
83
-
84
-
85
-
86
-
87
-
88
-
89
-
90
-
91
-
92
-
93
-
94
-
95
-
96
-
97
-
98
-
99
-
100
-
101
-
102
-
103
-
104
-
105
-
106
-
107
-
108
-
109
-
110
-
111
-
112
-
113
-
114
-
115
-
116
-
117
-
118
-
119
-
120
-
121
-
122
-
123
-
124
-
125
-
126
-
127
-
128
-
129
-
130
-
131
-
132
-
133
-
134
-
135
-
136
-
137
-
138
-
139
-
140
-
141
-
142
-
143
-
144
-
145
-
146
-
147
-
148
-
149
-
150
-
151
-
152
-
153
-
154
-
155
-
156
-
157
-
158
-
159
-
160
-
161
-
162
-
163
-
164
-
165
-
166
-
167
-
168
-
169
-
170
-
171
-
172
-
173
-
174
-
175
-
176
-
177
-
178
-
179
-
180
-
181
-
182
-
183
-
184
-
185
-
186
-
187
-
188
-
189
-
190
-
191
-
192
-
193
-
194
-
195
-
196
-
197
-
198
-
199
-
200
-
201
-
202
-
203
-
204
-
205
-
206
-
207
-
208
-
209
-
210
-
211
-
212
-
213
-
214
-
215
-
216
-
217
-
218
-
219
-
220
-
221
-
222
-
223
-
224
-
225
-
226
-
227
-
228
-
229
-
230
-
 231
231 -
 232
232 -
 233
233 -
 234
234 -
 235
235 -
 236
236 -
 237
237 -
 238
238 -
 239
239 -
 240
240 -
 241
241 -
 242
242 -
 243
243 -
 244
244 -
 245
245 -
 246
246 -
 247
247 -
 248
248 -
 249
249 -
 250
250 -
 251
251 -
252
-
253
-
254
-
255
-
256
-
257
-
258
-
259
-
260
-
261
-
262
-
263
-
264
-
265
-
266
-
267
-
268
-
269
-
270
-
271
-
272
-
273
-
274
-
275
-
276
-
277
-
278
-
279
-
280
-
281
-
282
-
283
-
284
-
285
-
286
-
287
-
288
-
289
-
290
-
291
-
292
-
293
-
294
-
295
-
296
-
297
-
298
-
299
-
300
-
301
-
302
-
303
-
304
-
305
-
306
-
307
-
308
-
309
-
310
-
311
 |
 |

CAPITAL ONE FINANCIAL CORPORATION
NOTES TO CONSOLIDATED FINANCIAL STATEMENTS—(Continued)
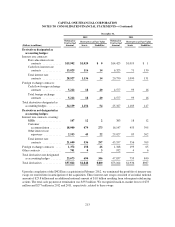
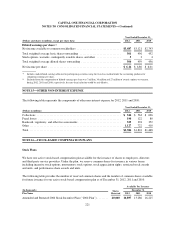
We issue new shares of common or treasury stock upon the settlement of options and stock-based incentive
awards.
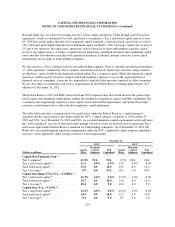
We generally recognize compensation expense on a straight-line basis over the award’s service period; however,
we will recognize compensation expense using the accelerated attribution method when the award contains a
performance condition with graded vesting. In addition, our cash equity units and cash-settled restricted stock
units are accounted for as liability awards pursuant to which the expense fluctuates with changes in our stock
price until the awards are settled. Awards that continue to vest after retirement are expensed over the shorter of
the period of time between the grant date and the final vesting period or between the grant date and when the
participant becomes retirement eligible; awards to participants who are retirement eligible at the grant date are
subject to immediate expensing upon grant. Total compensation expense recognized for stock-based
compensation for 2012, 2011 and 2010 was $202 million, $189 million and $149 million, respectively. The total
income tax benefit recognized in the consolidated statements of income for stock-based compensation for 2012,
2011 and 2010 was $77 million, $66 million and $52 million, respectively.
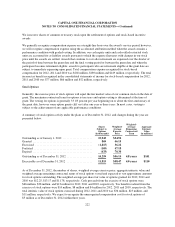
Stock Options
Generally, the exercise price of stock options will equal the fair market value of our common stock on the date of
grant. The maximum contractual term for options is ten years and option vesting is determined at the time of
grant. The vesting for options is generally 33 1/3 percent per year beginning on or about the first anniversary of
the grant date, however some option grants cliff vest after one year or three years. In most cases, vesting is
subject to the achievement of any applicable performance conditions.
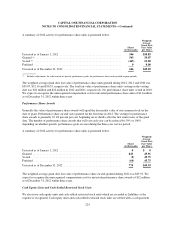
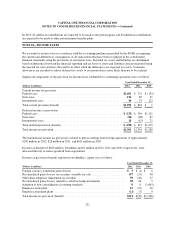
A summary of stock option activity under the plans as of December 31, 2012, and changes during the year are
presented below:
Shares
Subject to
Options
(in thousands)
Weighted-
Average
Exercise
Price
Weighted-
Average
Remaining
Contractual
Term
Aggregate
Intrinsic
Value
(in millions)
Outstanding as of January 1, 2012 ..................... 15,943 $54.92
Granted .......................................... 869 46.15
Exercised ........................................ (1,815) 36.22
Forfeited ......................................... (105) 47.18
Expired .......................................... (633) 70.30
Outstanding as of December 31, 2012 .................. 14,259 $56.14 4.8 years $141
Exercisable as of December 31, 2012 .................. 11,815 $58.47 4.0 years $110
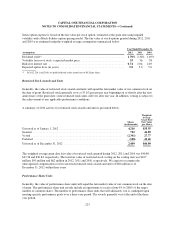
As of December 31, 2012, the number of shares, weighted average exercise price, aggregate intrinsic value and
weighted average remaining contractual terms of stock options vested and expected to vest approximate amounts
for stock options outstanding. The weighted-average per share fair value of options granted for 2012, 2011 and
2010 was $12.25, $13.17 and $11.78, respectively. Cash proceeds from the exercise of stock options were
$66 million, $38 million, and $13 million for 2012, 2011 and 2010, respectively. Tax benefits realized from the
exercise of stock options were $14 million, $8 million and $4 million for 2012, 2011 and 2010, respectively. The
total intrinsic value of stock options exercised during 2012, 2011 and 2010 was $36 million, $23 million, and
$11 million, respectively. We expect to recognize the unrecognized compensation cost for stock options of
$5 million as of December 31, 2012 within three years.
222