Capital One 2012 Annual Report Download - page 128
Download and view the complete annual report
Please find page 128 of the 2012 Capital One annual report below. You can navigate through the pages in the report by either clicking on the pages listed below, or by using the keyword search tool below to find specific information within the annual report.-
 1
1 -
2
-
3
-
4
-
5
-
6
-
7
-
8
-
9
-
10
-
11
-
12
-
13
-
14
-
15
-
16
-
17
-
18
-
19
-
20
-
21
-
22
-
23
-
24
-
25
-
26
-
27
-
28
-
29
-
30
-
31
-
32
-
33
-
34
-
35
-
36
-
37
-
38
-
39
-
40
-
41
-
42
-
43
-
44
-
45
-
46
-
47
-
48
-
49
-
50
-
51
-
52
-
53
-
54
-
55
-
56
-
57
-
58
-
59
-
60
-
61
-
62
-
63
-
64
-
65
-
66
-
67
-
68
-
69
-
70
-
71
-
72
-
73
-
74
-
75
-
76
-
77
-
78
-
79
-
80
-
81
-
82
-
83
-
84
-
85
-
86
-
87
-
88
-
89
-
90
-
91
-
92
-
93
-
94
-
95
-
96
-
97
-
98
-
99
-
100
-
101
-
102
-
103
-
104
-
105
-
106
-
107
-
108
-
109
-
110
-
111
-
112
-
113
-
114
-
115
-
116
-
117
-
 118
118 -
 119
119 -
 120
120 -
 121
121 -
 122
122 -
 123
123 -
 124
124 -
 125
125 -
 126
126 -
 127
127 -
 128
128 -
 129
129 -
 130
130 -
 131
131 -
 132
132 -
 133
133 -
 134
134 -
 135
135 -
 136
136 -
 137
137 -
 138
138 -
139
-
140
-
141
-
142
-
143
-
144
-
145
-
146
-
147
-
148
-
149
-
150
-
151
-
152
-
153
-
154
-
155
-
156
-
157
-
158
-
159
-
160
-
161
-
162
-
163
-
164
-
165
-
166
-
167
-
168
-
169
-
170
-
171
-
172
-
173
-
174
-
175
-
176
-
177
-
178
-
179
-
180
-
181
-
182
-
183
-
184
-
185
-
186
-
187
-
188
-
189
-
190
-
191
-
192
-
193
-
194
-
195
-
196
-
197
-
198
-
199
-
200
-
201
-
202
-
203
-
204
-
205
-
206
-
207
-
208
-
209
-
210
-
211
-
212
-
213
-
214
-
215
-
216
-
217
-
218
-
219
-
220
-
221
-
222
-
223
-
224
-
225
-
226
-
227
-
228
-
229
-
230
-
231
-
232
-
233
-
234
-
235
-
236
-
237
-
238
-
239
-
240
-
241
-
242
-
243
-
244
-
245
-
246
-
247
-
248
-
249
-
250
-
251
-
252
-
253
-
254
-
255
-
256
-
257
-
258
-
259
-
260
-
261
-
262
-
263
-
264
-
265
-
266
-
267
-
268
-
269
-
270
-
271
-
272
-
273
-
274
-
275
-
276
-
277
-
278
-
279
-
280
-
281
-
282
-
283
-
284
-
285
-
286
-
287
-
288
-
289
-
290
-
291
-
292
-
293
-
294
-
295
-
296
-
297
-
298
-
299
-
300
-
301
-
302
-
303
-
304
-
305
-
306
-
307
-
308
-
309
-
310
-
311
 |
 |

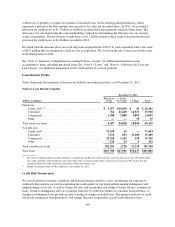
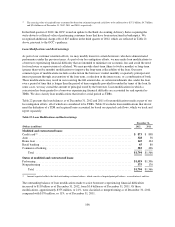
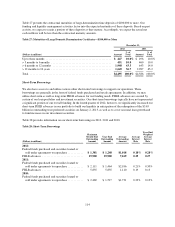
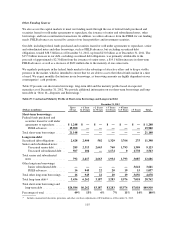
Table 23: Allowance for Loan and Lease Losses Activity
December 31,
(Dollars in millions) 2012 2011 2010
Balance at beginning of period, as reported ............................... $ 4,250 $ 5,628 $ 4,127
Impact from January 1, 2010 adoption of new consolidation accounting
standards(1) ...................................................... —— 4,317
Balance at beginning of period, as adjusted ............................... 4,250 5,628 8,444
Provision for credit losses(2) (3) ......................................... 4,446 2,401 3,895
Charge-offs:
Credit Card business:(3)
Domestic credit card and installment loans ............................... (3,507) (3,558) (6,020)
International credit card .............................................. (652) (752) (761)
Total credit card ................................................ (4,159) (4,310) (6,781)
Consumer Banking business:
Auto.............................................................. (631) (529) (672)
Home loan ......................................................... (77) (104) (97)
Retail banking ...................................................... (89) (99) (129)
Total consumer banking .......................................... (797) (732) (898)
Commercial Banking business:
Commercial and multifamily real estate .................................. (23) (76) (208)
Commercial and industrial ............................................ (32) (61) (137)
Total commercial lending ......................................... (55) (137) (345)
Small-ticket commercial real estate ..................................... (39) (77) (100)
Total commercial banking ........................................ (94) (214) (445)
Other loans ........................................................ (43) (59) (114)
Total charge-offs .................................................... (5,093) (5,315) (8,238)
Recoveries:
Credit Card business:
Domestic credit card and installment loans ............................... 975 1,036 1,113
International credit card .............................................. 240 218 169
Total credit card ................................................ 1,215 1,254 1,282
Consumer Banking business:
Auto.............................................................. 217 195 215
Home loan ......................................................... 25 27 4
Retail banking ...................................................... 24 26 24
Total consumer banking .......................................... 266 248 243
Commercial Banking business:
Commercial and multifamily real estate .................................. 18 12 20
Commercial and industrial ............................................ 25 20 32
Total commercial lending ......................................... 43 32 52
Small-ticket commercial real estate ..................................... 952
Total commercial banking ........................................ 52 37 54
Other loans ........................................................ 558
Total recoveries ..................................................... 1,538 1,544 1,587
Net charge-offs ..................................................... (3,555) (3,771) (6,651)
Impact loan sales and other changes(3) ................................... 15 (8) (60)(4)
Balance at end of period(3) ............................................ $ 5,156 $ 4,250 $ 5,628
Allowance for loan and lease losses as a percentage of loans held for
investment ....................................................... 2.50% 3.13% 4.47%
109