Capital One 2012 Annual Report Download - page 132
Download and view the complete annual report
Please find page 132 of the 2012 Capital One annual report below. You can navigate through the pages in the report by either clicking on the pages listed below, or by using the keyword search tool below to find specific information within the annual report.-
 1
1 -
2
-
3
-
4
-
5
-
6
-
7
-
8
-
9
-
10
-
11
-
12
-
13
-
14
-
15
-
16
-
17
-
18
-
19
-
20
-
21
-
22
-
23
-
24
-
25
-
26
-
27
-
28
-
29
-
30
-
31
-
32
-
33
-
34
-
35
-
36
-
37
-
38
-
39
-
40
-
41
-
42
-
43
-
44
-
45
-
46
-
47
-
48
-
49
-
50
-
51
-
52
-
53
-
54
-
55
-
56
-
57
-
58
-
59
-
60
-
61
-
62
-
63
-
64
-
65
-
66
-
67
-
68
-
69
-
70
-
71
-
72
-
73
-
74
-
75
-
76
-
77
-
78
-
79
-
80
-
81
-
82
-
83
-
84
-
85
-
86
-
87
-
88
-
89
-
90
-
91
-
92
-
93
-
94
-
95
-
96
-
97
-
98
-
99
-
100
-
101
-
102
-
103
-
104
-
105
-
106
-
107
-
108
-
109
-
110
-
111
-
112
-
113
-
114
-
115
-
116
-
117
-
118
-
119
-
120
-
121
-
 122
122 -
 123
123 -
 124
124 -
 125
125 -
 126
126 -
 127
127 -
 128
128 -
 129
129 -
 130
130 -
 131
131 -
 132
132 -
 133
133 -
 134
134 -
 135
135 -
 136
136 -
 137
137 -
 138
138 -
 139
139 -
 140
140 -
 141
141 -
 142
142 -
143
-
144
-
145
-
146
-
147
-
148
-
149
-
150
-
151
-
152
-
153
-
154
-
155
-
156
-
157
-
158
-
159
-
160
-
161
-
162
-
163
-
164
-
165
-
166
-
167
-
168
-
169
-
170
-
171
-
172
-
173
-
174
-
175
-
176
-
177
-
178
-
179
-
180
-
181
-
182
-
183
-
184
-
185
-
186
-
187
-
188
-
189
-
190
-
191
-
192
-
193
-
194
-
195
-
196
-
197
-
198
-
199
-
200
-
201
-
202
-
203
-
204
-
205
-
206
-
207
-
208
-
209
-
210
-
211
-
212
-
213
-
214
-
215
-
216
-
217
-
218
-
219
-
220
-
221
-
222
-
223
-
224
-
225
-
226
-
227
-
228
-
229
-
230
-
231
-
232
-
233
-
234
-
235
-
236
-
237
-
238
-
239
-
240
-
241
-
242
-
243
-
244
-
245
-
246
-
247
-
248
-
249
-
250
-
251
-
252
-
253
-
254
-
255
-
256
-
257
-
258
-
259
-
260
-
261
-
262
-
263
-
264
-
265
-
266
-
267
-
268
-
269
-
270
-
271
-
272
-
273
-
274
-
275
-
276
-
277
-
278
-
279
-
280
-
281
-
282
-
283
-
284
-
285
-
286
-
287
-
288
-
289
-
290
-
291
-
292
-
293
-
294
-
295
-
296
-
297
-
298
-
299
-
300
-
301
-
302
-
303
-
304
-
305
-
306
-
307
-
308
-
309
-
310
-
311
 |
 |

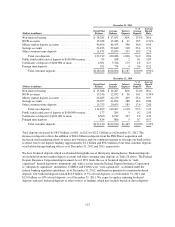
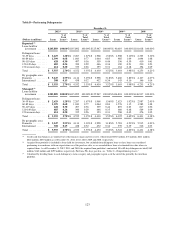
December 31, 2011
(Dollars in millions)
Period End
Balance
Average
Balance
Interest
Expense
% of
Average
Deposits
Average
Deposit
Rate
Non-interest bearing .............................. $ 18,281 $ 17,051 N/A 13.5% N/A
NOW accounts ................................... 15,038 13,285 $ 41 10.5 0.31%
Money market deposit accounts ..................... 46,496 46,455 396 36.6 0.85
Savings accounts ................................. 31,433 29,640 218 23.4 0.74
Other consumer time deposits ....................... 11,471 13,855 351 10.9 2.53
Total core deposits ............................ 122,719 120,286 1,006 94.9 0.84
Public fund certificates of deposit of $100,000 or more . . . 85 108 2 0.1 1.85
Certificates of deposit of $100,000 or more ............ 4,501 5,526 175 4.4 3.17
Foreign time deposits .............................. 921 774 4 0.6 0.52
Total customer deposits ........................ $128,226 $126,694 $1,187 100.0% 0.94%
December 31, 2010
(Dollars in millions)
Period End
Balance
Average
Balance
Interest
Expense
% of
Average
Deposits
Average
Deposit
Rate
Non-interest bearing .............................. $ 15,048 $ 14,267 N/A 12.0% N/A
NOW accounts ................................... 13,536 12,032 $ 36 10.1 0.30%
Money market deposit accounts ..................... 44,485 42,159 409 35.4 0.97
Savings accounts ................................. 26,077 21,854 188 18.4 0.86
Other consumer time deposits ....................... 15,753 20,655 585 17.4 2.83
Total core deposits ............................ 114,899 110,967 1,218 93.3 1.10
Public fund certificates of deposit of $100,000 or more . . . 177 265 5 0.2 2.03
Certificates of deposit of $100,000 or more ............ 6,300 6,912 237 5.8 3.43
Foreign time deposits .............................. 834 866 5 0.7 0.57
Total customer deposits ........................ $122,210 $119,010 $1,465 100.0% 1.23%
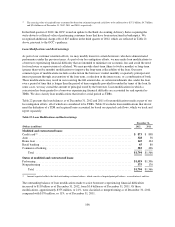
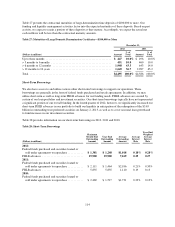
Total deposits increased by $84.3 billion, or 66%, in 2012 to $212.5 billion as of December 31, 2012. The
increase in deposits reflects the addition of $84.4 billion in deposits from the ING Direct acquisition and
increased retail marketing efforts to attract new business and our continued strategy to leverage our bank outlets
to attract lower cost deposit funding. Approximately $1.1 billion and $921 million of our total customer deposits
were held in foreign banking offices as of December 31, 2012 and 2011, respectively.
We have brokered deposits which we obtained through the use of third-party intermediaries. Brokered deposits
are included in money market deposit accounts and other consumer time deposits in Table 26 above. The Federal
Deposit Insurance Corporation Improvement Act of 1991 limits the use of brokered deposits to “well-
capitalized” insured depository institutions and, with a waiver from the Federal Deposit Insurance Corporation,
to “adequately capitalized” institutions. COBNA and CONA were “well-capitalized,” as defined under the
federal banking regulatory guidelines, as of December 31, 2012, and therefore permitted to maintain brokered
deposits. Our brokered deposits totaled $10.0 billion, or 5% of total deposits, as of December 31, 2012 and
$13.0 billion, or 10% of total deposits, as of December 31, 2011. We expect to replace maturing brokered
deposits with new brokered deposits or other sources of funding, which may include branch or direct deposits.
113