Capital One 2012 Annual Report Download - page 263
Download and view the complete annual report
Please find page 263 of the 2012 Capital One annual report below. You can navigate through the pages in the report by either clicking on the pages listed below, or by using the keyword search tool below to find specific information within the annual report.-
 1
1 -
2
-
3
-
4
-
5
-
6
-
7
-
8
-
9
-
10
-
11
-
12
-
13
-
14
-
15
-
16
-
17
-
18
-
19
-
20
-
21
-
22
-
23
-
24
-
25
-
26
-
27
-
28
-
29
-
30
-
31
-
32
-
33
-
34
-
35
-
36
-
37
-
38
-
39
-
40
-
41
-
42
-
43
-
44
-
45
-
46
-
47
-
48
-
49
-
50
-
51
-
52
-
53
-
54
-
55
-
56
-
57
-
58
-
59
-
60
-
61
-
62
-
63
-
64
-
65
-
66
-
67
-
68
-
69
-
70
-
71
-
72
-
73
-
74
-
75
-
76
-
77
-
78
-
79
-
80
-
81
-
82
-
83
-
84
-
85
-
86
-
87
-
88
-
89
-
90
-
91
-
92
-
93
-
94
-
95
-
96
-
97
-
98
-
99
-
100
-
101
-
102
-
103
-
104
-
105
-
106
-
107
-
108
-
109
-
110
-
111
-
112
-
113
-
114
-
115
-
116
-
117
-
118
-
119
-
120
-
121
-
122
-
123
-
124
-
125
-
126
-
127
-
128
-
129
-
130
-
131
-
132
-
133
-
134
-
135
-
136
-
137
-
138
-
139
-
140
-
141
-
142
-
143
-
144
-
145
-
146
-
147
-
148
-
149
-
150
-
151
-
152
-
153
-
154
-
155
-
156
-
157
-
158
-
159
-
160
-
161
-
162
-
163
-
164
-
165
-
166
-
167
-
168
-
169
-
170
-
171
-
172
-
173
-
174
-
175
-
176
-
177
-
178
-
179
-
180
-
181
-
182
-
183
-
184
-
185
-
186
-
187
-
188
-
189
-
190
-
191
-
192
-
193
-
194
-
195
-
196
-
197
-
198
-
199
-
200
-
201
-
202
-
203
-
204
-
205
-
206
-
207
-
208
-
209
-
210
-
211
-
212
-
213
-
214
-
215
-
216
-
217
-
218
-
219
-
220
-
221
-
222
-
223
-
224
-
225
-
226
-
227
-
228
-
229
-
230
-
231
-
232
-
233
-
234
-
235
-
236
-
237
-
238
-
239
-
240
-
241
-
242
-
243
-
244
-
245
-
246
-
247
-
248
-
249
-
250
-
251
-
252
-
 253
253 -
 254
254 -
 255
255 -
 256
256 -
 257
257 -
 258
258 -
 259
259 -
 260
260 -
 261
261 -
 262
262 -
 263
263 -
 264
264 -
 265
265 -
 266
266 -
 267
267 -
 268
268 -
 269
269 -
 270
270 -
 271
271 -
 272
272 -
 273
273 -
274
-
275
-
276
-
277
-
278
-
279
-
280
-
281
-
282
-
283
-
284
-
285
-
286
-
287
-
288
-
289
-
290
-
291
-
292
-
293
-
294
-
295
-
296
-
297
-
298
-
299
-
300
-
301
-
302
-
303
-
304
-
305
-
306
-
307
-
308
-
309
-
310
-
311
 |
 |

CAPITAL ONE FINANCIAL CORPORATION
NOTES TO CONSOLIDATED FINANCIAL STATEMENTS—(Continued)
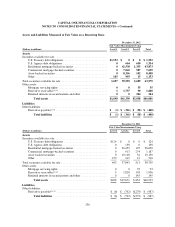
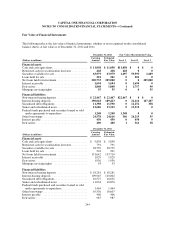
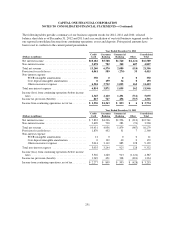
Fair Value of Financial Instruments
The following reflects the fair value of financial instruments, whether or not recognized on the consolidated
balance sheets, at fair value as of December 31, 2012 and 2011:
December 31, 2012 Fair Value Measurements Using
(Dollars in millions)
Carrying
Amount
Estimated
Fair Value Level 1 Level 2 Level 3
Financial assets
Cash and cash equivalents ........................ $ 11,058 $ 11,058 $11,058 $ 0 $ 0
Restricted cash for securitization investors ........... 428 428 428 0 0
Securities available for sale ....................... 63,979 63,979 1,697 59,593 2,689
Loans held for sale .............................. 201 201 0 201 0
Net loans held for investment ..................... 200,733 205,000 0 0 205,000
Interest receivable .............................. 1,694 1,694 0 1,694 0
Derivatives .................................... 1,848 1,848 1 1,757 90
Mortgage servicing rights ........................ 55 55 0 0 55
Financial liabilities
Non-interest bearing deposits ..................... $ 22,467 $ 22,467 $22,467 $ 0 $ 0
Interest-bearing deposits ......................... 190,018 189,423 0 22,216 167,207
Securitized debt obligations ....................... 11,398 11,590 0 11,252 338
Senior and subordinated notes ..................... 12,686 13,312 0 13,312 0
Federal funds purchased and securities loaned or sold
under agreements to repurchase .................. 1,248 1,248 1,248 0 0
Other borrowings ............................... 24,578 24,616 346 24,215 55
Interest payable ................................ 450 450 0 450 0
Derivatives .................................... 400 400 1 361 38
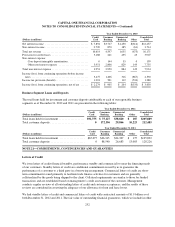
December 31, 2011
(Dollars in millions)
Carrying
Amount
Estimated
Fair Value
Financial assets
Cash and cash equivalents ........................ $ 5,838 $ 5,838
Restricted cash for securitization investors ........... 791 791
Securities available for sale ....................... 38,759 38,759
Loans held for sale .............................. 201 201
Net loans held for investment ..................... 131,642 133,710
Interest receivable .............................. 1,029 1,029
Derivatives .................................... 1,936 1,936
Mortgage servicing rights ........................ 93 93
Financial liabilities
Non-interest bearing deposits ..................... $ 18,281 $ 18,281
Interest-bearing deposits ......................... 109,945 110,002
Securitized debt obligations ....................... 16,527 16,632
Senior and subordinated notes ..................... 11,034 10,870
Federal funds purchased and securities loaned or sold
under agreements to repurchase .................. 1,464 1,464
Other borrowings ............................... 10,536 10,607
Interest payable ................................ 466 466
Derivatives .................................... 987 987
244