Capital One 2012 Annual Report Download - page 181
Download and view the complete annual report
Please find page 181 of the 2012 Capital One annual report below. You can navigate through the pages in the report by either clicking on the pages listed below, or by using the keyword search tool below to find specific information within the annual report.-
 1
1 -
2
-
3
-
4
-
5
-
6
-
7
-
8
-
9
-
10
-
11
-
12
-
13
-
14
-
15
-
16
-
17
-
18
-
19
-
20
-
21
-
22
-
23
-
24
-
25
-
26
-
27
-
28
-
29
-
30
-
31
-
32
-
33
-
34
-
35
-
36
-
37
-
38
-
39
-
40
-
41
-
42
-
43
-
44
-
45
-
46
-
47
-
48
-
49
-
50
-
51
-
52
-
53
-
54
-
55
-
56
-
57
-
58
-
59
-
60
-
61
-
62
-
63
-
64
-
65
-
66
-
67
-
68
-
69
-
70
-
71
-
72
-
73
-
74
-
75
-
76
-
77
-
78
-
79
-
80
-
81
-
82
-
83
-
84
-
85
-
86
-
87
-
88
-
89
-
90
-
91
-
92
-
93
-
94
-
95
-
96
-
97
-
98
-
99
-
100
-
101
-
102
-
103
-
104
-
105
-
106
-
107
-
108
-
109
-
110
-
111
-
112
-
113
-
114
-
115
-
116
-
117
-
118
-
119
-
120
-
121
-
122
-
123
-
124
-
125
-
126
-
127
-
128
-
129
-
130
-
131
-
132
-
133
-
134
-
135
-
136
-
137
-
138
-
139
-
140
-
141
-
142
-
143
-
144
-
145
-
146
-
147
-
148
-
149
-
150
-
151
-
152
-
153
-
154
-
155
-
156
-
157
-
158
-
159
-
160
-
161
-
162
-
163
-
164
-
165
-
166
-
167
-
168
-
169
-
170
-
 171
171 -
 172
172 -
 173
173 -
 174
174 -
 175
175 -
 176
176 -
 177
177 -
 178
178 -
 179
179 -
 180
180 -
 181
181 -
 182
182 -
 183
183 -
 184
184 -
 185
185 -
 186
186 -
 187
187 -
 188
188 -
 189
189 -
 190
190 -
 191
191 -
192
-
193
-
194
-
195
-
196
-
197
-
198
-
199
-
200
-
201
-
202
-
203
-
204
-
205
-
206
-
207
-
208
-
209
-
210
-
211
-
212
-
213
-
214
-
215
-
216
-
217
-
218
-
219
-
220
-
221
-
222
-
223
-
224
-
225
-
226
-
227
-
228
-
229
-
230
-
231
-
232
-
233
-
234
-
235
-
236
-
237
-
238
-
239
-
240
-
241
-
242
-
243
-
244
-
245
-
246
-
247
-
248
-
249
-
250
-
251
-
252
-
253
-
254
-
255
-
256
-
257
-
258
-
259
-
260
-
261
-
262
-
263
-
264
-
265
-
266
-
267
-
268
-
269
-
270
-
271
-
272
-
273
-
274
-
275
-
276
-
277
-
278
-
279
-
280
-
281
-
282
-
283
-
284
-
285
-
286
-
287
-
288
-
289
-
290
-
291
-
292
-
293
-
294
-
295
-
296
-
297
-
298
-
299
-
300
-
301
-
302
-
303
-
304
-
305
-
306
-
307
-
308
-
309
-
310
-
311
 |
 |

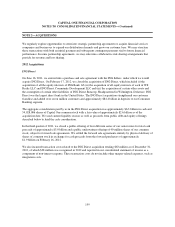
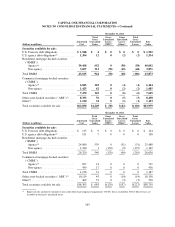
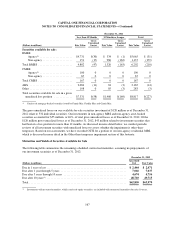
CAPITAL ONE FINANCIAL CORPORATION
NOTES TO CONSOLIDATED FINANCIAL STATEMENTS—(Continued)
(Dollars in millions) Fair Value
Purchase price:
Cash ............................................................................. $31,343
Receivable due from HSBC ........................................................... (252)
Total consideration transferred ..................................................... $31,091
Allocation of purchase price to net assets acquired:
Assets:
Loans receivable(1) .................................................................. $28,234
Other assets ........................................................................ 357
Premises and equipment .............................................................. 502
Intangible assets .................................................................... 2,212
Total assets .................................................................... 31,305
Liabilities:
Other liabilities ..................................................................... 518
Total liabilities ................................................................. 518
Net assets acquired .............................................................. 30,787
Goodwill ...................................................................... $ 304
(1) Loans receivable includes the fair value of unpaid principal balances of loans, the associated accrued interest and balances in certain loan
settlement accounts.
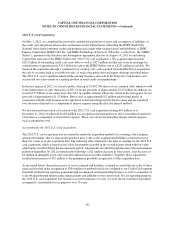
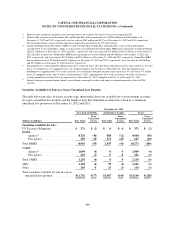
ING Direct and the 2012 U.S. Card Acquisition Results
Our results for 2012 include the operations of ING Direct from the acquisition date of February 17, 2012,
through December 31, 2012 and the operations of the 2012 U.S. card acquisition business from the acquisition
date of May 1, 2012 through December 31, 2012.
The tables below present the estimated impact of the ING Direct acquisition and the 2012 U.S. card acquisition
on our revenue and income from continuing operations, net of tax for 2012. These amounts do not include certain
corporate expenses, transaction costs, or merger-related expenses that resulted from the two acquisitions and are
therefore not representative of the actual results of the operations of these businesses on a stand-alone basis. We
continue to integrate these businesses into our existing operations, and throughout the year, it has become more
challenging to separately identify and estimate these operating results. During the fourth quarter of this year, we
merged ING Bank, fsb into CONA with CONA surviving the merger. As a result, stand-alone financial
statements for the ING Direct legal entity are not available for the annual period ending December 31, 2012.
The results provided in the table below are based upon actual results for the ING Bank, fsb legal entity prior to its
merger into CONA, as well as estimates of actual ING Direct operating results following the merger. The 2012
U.S. card acquisition did not involve the acquisition of an entire legal entity and stand-alone income statements
were not available for all periods presented in the pro forma disclosures. To determine the amounts provided
below, we relied on historical HSBC management reports as well as our own internal reports prepared following
the acquisition. Also included in the combined pro forma results are adjustments to reflect the impact of
amortizing certain purchase accounting adjustments, such as the amortization of intangible assets and the
accretion of interest income on certain acquired loans. The table also includes condensed pro forma information
on our combined results of operations as they may have appeared assuming the ING Direct acquisition and 2012
U.S. card acquisition had been completed on January 1, 2011. Because the bargain purchase gain recognized in
162