Capital One 2012 Annual Report Download - page 91
Download and view the complete annual report
Please find page 91 of the 2012 Capital One annual report below. You can navigate through the pages in the report by either clicking on the pages listed below, or by using the keyword search tool below to find specific information within the annual report.-
 1
1 -
2
-
3
-
4
-
5
-
6
-
7
-
8
-
9
-
10
-
11
-
12
-
13
-
14
-
15
-
16
-
17
-
18
-
19
-
20
-
21
-
22
-
23
-
24
-
25
-
26
-
27
-
28
-
29
-
30
-
31
-
32
-
33
-
34
-
35
-
36
-
37
-
38
-
39
-
40
-
41
-
42
-
43
-
44
-
45
-
46
-
47
-
48
-
49
-
50
-
51
-
52
-
53
-
54
-
55
-
56
-
57
-
58
-
59
-
60
-
61
-
62
-
63
-
64
-
65
-
66
-
67
-
68
-
69
-
70
-
71
-
72
-
73
-
74
-
75
-
76
-
77
-
78
-
79
-
80
-
 81
81 -
 82
82 -
 83
83 -
 84
84 -
 85
85 -
 86
86 -
 87
87 -
 88
88 -
 89
89 -
 90
90 -
 91
91 -
 92
92 -
 93
93 -
 94
94 -
 95
95 -
 96
96 -
 97
97 -
 98
98 -
 99
99 -
 100
100 -
 101
101 -
102
-
103
-
104
-
105
-
106
-
107
-
108
-
109
-
110
-
111
-
112
-
113
-
114
-
115
-
116
-
117
-
118
-
119
-
120
-
121
-
122
-
123
-
124
-
125
-
126
-
127
-
128
-
129
-
130
-
131
-
132
-
133
-
134
-
135
-
136
-
137
-
138
-
139
-
140
-
141
-
142
-
143
-
144
-
145
-
146
-
147
-
148
-
149
-
150
-
151
-
152
-
153
-
154
-
155
-
156
-
157
-
158
-
159
-
160
-
161
-
162
-
163
-
164
-
165
-
166
-
167
-
168
-
169
-
170
-
171
-
172
-
173
-
174
-
175
-
176
-
177
-
178
-
179
-
180
-
181
-
182
-
183
-
184
-
185
-
186
-
187
-
188
-
189
-
190
-
191
-
192
-
193
-
194
-
195
-
196
-
197
-
198
-
199
-
200
-
201
-
202
-
203
-
204
-
205
-
206
-
207
-
208
-
209
-
210
-
211
-
212
-
213
-
214
-
215
-
216
-
217
-
218
-
219
-
220
-
221
-
222
-
223
-
224
-
225
-
226
-
227
-
228
-
229
-
230
-
231
-
232
-
233
-
234
-
235
-
236
-
237
-
238
-
239
-
240
-
241
-
242
-
243
-
244
-
245
-
246
-
247
-
248
-
249
-
250
-
251
-
252
-
253
-
254
-
255
-
256
-
257
-
258
-
259
-
260
-
261
-
262
-
263
-
264
-
265
-
266
-
267
-
268
-
269
-
270
-
271
-
272
-
273
-
274
-
275
-
276
-
277
-
278
-
279
-
280
-
281
-
282
-
283
-
284
-
285
-
286
-
287
-
288
-
289
-
290
-
291
-
292
-
293
-
294
-
295
-
296
-
297
-
298
-
299
-
300
-
301
-
302
-
303
-
304
-
305
-
306
-
307
-
308
-
309
-
310
-
311
 |
 |

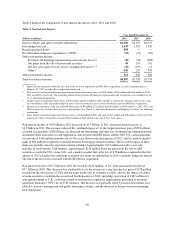
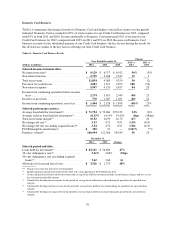
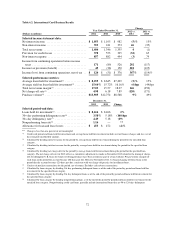
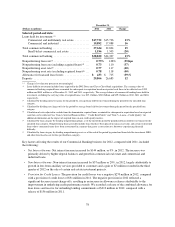
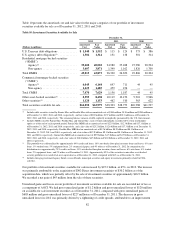
Table 6.2: International Card Business Results
(Dollars in millions)
Year Ended December 31,
Change
2012 vs.
2011
2011 vs.
20102012 2011 2010
Selected income statement data:
Net interest income ............................ $ 1,053 $ 1,105 $ 982 (5)% 13%
Non-interest income ............................ 353 241 373 46 (35)
Total net revenue .............................. 1,406 1,346 1,355 4(1)
Provision for credit losses ....................... 378 553 335 (32) 65
Non-interest expense ........................... 857 882 494 (3) 79
Income from continuing operations before income
taxes ...................................... 171 (89) 526 292 (117)
Income tax provision (benefit) .................... 45 (38) 150 218 (125)
Income (loss) from continuing operations, net of tax . . $ 126 $ (51) $ 376 347% (114)%
Selected performance metrics:
Average loans held for investment(1) ............... $ 8,255 $ 8,645 $7,499 (5)% 15%
Average yield on loans held for investment(2) ........ 15.66% 15.72% 16.16% (6)bps (44)bps
Total net revenue margin(3) ...................... 17.03 15.57 18.07 146 (250)
Net charge-off rate(4) ........................... 4.98 6.18 7.89 (120) (171)
Purchase volume(5) ............................. $13,905 $12,754 $8,568 9% 49%
December 31,
2012 2011 Change
Selected period-end data:
Loans held for investment(1) ...................... $ 8,614 $ 8,466 2%
30+ day performing delinquency rate(6) ............. 3.58% 5.18% (160)bps
30+ day delinquency rate(7) ...................... 4.49 5.18 (69)
Nonperforming loan rate(8) ....................... 1.16 —**
Allowance for loan and lease losses ............... $ 453 $ 472 (4)%
** Change is less than one percent or not meaningful.
(1) Credit card period-end loans held for investment and average loans held for investment include accrued finance charges and fees, net of
the estimated uncollectible amount.
(2) Calculated by dividing interest income for the period by average loans held for investment during the period for the specified loan
category.
(3) Calculated by dividing total net revenue for the period by average loans held for investment during the period for the specified loan
category.
(4) Calculated by dividing net charge-offs for the period by average loans held for investment during the period for the specified loan
category. The net charge-off rate for 2012 reflects a cumulative adjustment we made in November 2012 related to the timing of charge-
offs for delinquent U.K. loans for which revolving privileges have been revoked as part of a loan workout. We previously charged off
such loans in the period the account became 180 days past due. Effective November 2012, we began charging off these loans in the
period that the account becomes 120 days past due, consistent with our charge-off practice for installment loans.
(5) Consists of purchase transactions for the period, net of returns. Excludes cash advance transactions.
(6) Calculated by loan category by dividing 30+ day performing delinquent loans as of the end of the period by period-end loans held for
investment for the specified loan category.
(7) Calculated by loan category by dividing 30+ day delinquent loans as of the end of the period by period-end loans held for investment for
the specified loan category.
(8) Calculated by loan category by dividing nonperforming loans as of the end of the period by period-end loans held for investment for the
specified loan category. Nonperforming credit card loans generally include international loans that are 90 or 120 days delinquent.
72