Capital One 2012 Annual Report Download - page 94
Download and view the complete annual report
Please find page 94 of the 2012 Capital One annual report below. You can navigate through the pages in the report by either clicking on the pages listed below, or by using the keyword search tool below to find specific information within the annual report.-
 1
1 -
2
-
3
-
4
-
5
-
6
-
7
-
8
-
9
-
10
-
11
-
12
-
13
-
14
-
15
-
16
-
17
-
18
-
19
-
20
-
21
-
22
-
23
-
24
-
25
-
26
-
27
-
28
-
29
-
30
-
31
-
32
-
33
-
34
-
35
-
36
-
37
-
38
-
39
-
40
-
41
-
42
-
43
-
44
-
45
-
46
-
47
-
48
-
49
-
50
-
51
-
52
-
53
-
54
-
55
-
56
-
57
-
58
-
59
-
60
-
61
-
62
-
63
-
64
-
65
-
66
-
67
-
68
-
69
-
70
-
71
-
72
-
73
-
74
-
75
-
76
-
77
-
78
-
79
-
80
-
81
-
82
-
83
-
 84
84 -
 85
85 -
 86
86 -
 87
87 -
 88
88 -
 89
89 -
 90
90 -
 91
91 -
 92
92 -
 93
93 -
 94
94 -
 95
95 -
 96
96 -
 97
97 -
 98
98 -
 99
99 -
 100
100 -
 101
101 -
 102
102 -
 103
103 -
 104
104 -
105
-
106
-
107
-
108
-
109
-
110
-
111
-
112
-
113
-
114
-
115
-
116
-
117
-
118
-
119
-
120
-
121
-
122
-
123
-
124
-
125
-
126
-
127
-
128
-
129
-
130
-
131
-
132
-
133
-
134
-
135
-
136
-
137
-
138
-
139
-
140
-
141
-
142
-
143
-
144
-
145
-
146
-
147
-
148
-
149
-
150
-
151
-
152
-
153
-
154
-
155
-
156
-
157
-
158
-
159
-
160
-
161
-
162
-
163
-
164
-
165
-
166
-
167
-
168
-
169
-
170
-
171
-
172
-
173
-
174
-
175
-
176
-
177
-
178
-
179
-
180
-
181
-
182
-
183
-
184
-
185
-
186
-
187
-
188
-
189
-
190
-
191
-
192
-
193
-
194
-
195
-
196
-
197
-
198
-
199
-
200
-
201
-
202
-
203
-
204
-
205
-
206
-
207
-
208
-
209
-
210
-
211
-
212
-
213
-
214
-
215
-
216
-
217
-
218
-
219
-
220
-
221
-
222
-
223
-
224
-
225
-
226
-
227
-
228
-
229
-
230
-
231
-
232
-
233
-
234
-
235
-
236
-
237
-
238
-
239
-
240
-
241
-
242
-
243
-
244
-
245
-
246
-
247
-
248
-
249
-
250
-
251
-
252
-
253
-
254
-
255
-
256
-
257
-
258
-
259
-
260
-
261
-
262
-
263
-
264
-
265
-
266
-
267
-
268
-
269
-
270
-
271
-
272
-
273
-
274
-
275
-
276
-
277
-
278
-
279
-
280
-
281
-
282
-
283
-
284
-
285
-
286
-
287
-
288
-
289
-
290
-
291
-
292
-
293
-
294
-
295
-
296
-
297
-
298
-
299
-
300
-
301
-
302
-
303
-
304
-
305
-
306
-
307
-
308
-
309
-
310
-
311
 |
 |

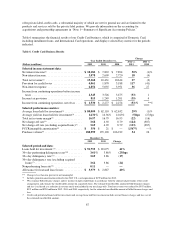
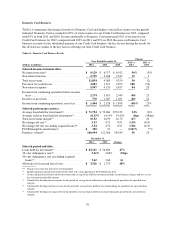
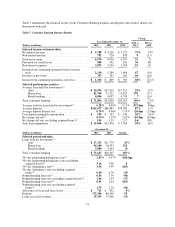
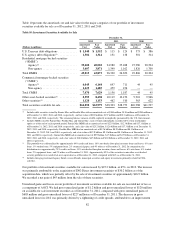
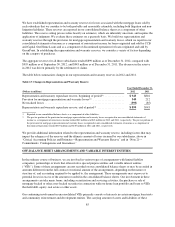
** Change is less than one percent or not meaningful.
(1) Loans held for investment includes loans acquired in the ING Direct and Chevy Chase Bank acquisitions. The carrying value of
consumer banking acquired loans accounted for subsequent to acquisition based on expected cash flows to be collected was $36.5 billion
and $4.2 billion as of December 31, 2012 and 2011, respectively. The average balance of consumer banking loans held for investment,
excluding the carrying value of acquired loans, was $36.7 billion, $30.3 billion and $30.2 billion in 2012, 2011 and 2010, respectively.
(2) Calculated by dividing interest income for the period by average loans held for investment during the period for the specified loan
category.
(3) Calculated by dividing net charge-offs for the period by average loans held for investment during the period for the specified loan
category.
(4) Calculation of ratio adjusted to exclude from the denominator acquired loans accounted for subsequent to acquisition based on expected
cash flows to be collected. See “Item 6. Selected Financial Data,” “Credit Risk Profile” and “Note 5—Loans—Credit Quality” for
additional information on the impact of acquired loans on our credit quality metrics.
(5) Calculated by loan category by dividing 30+ day performing delinquent loans as of the end of the period by period-end loans held for
investment for the specified loan category.
(6) Calculated by loan category by dividing 30+ day delinquent loans as of the end of the period by period-end loans held for investment for
the specified loan category.
(7) Calculated by loan category by dividing nonperforming loans as of the end of the period by period-end loans held for investment for the
specified loan category. Nonperforming loans generally include loans that have been placed on nonaccrual status and certain restructured
loans whose contractual terms have been restructured in a manner that grants a concession to a borrower experiencing financial
difficulty.
(8) Calculated by loan category by dividing nonperforming assets as of the end of the period by period-end nonperforming assets.
Nonperforming assets consist of nonperforming loans, real estate owned (“REO”) and other foreclosed assets.
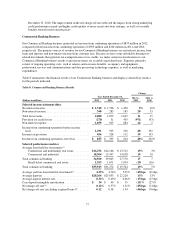
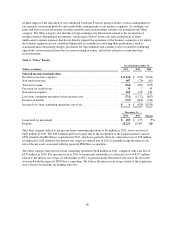
Key factors affecting the results of our Consumer Banking business for 2012, compared with 2011, included the
following:
•Net Interest Income: Net interest income increased by $1.6 billion, or 37%, in 2012. The increase was
primarily attributable to the addition of home loans from the ING Direct acquisition, continued growth and
strong margin performance in our auto loan portfolio and the addition of low-rate deposits from the ING
Direct acquisition. With the addition of deposits from ING Direct, average deposits increased to $162.6
billion in 2012, from $86.9 billion in 2011, while the average deposit interest rate fell to 0.70% in 2012,
from 0.96% in 2011. The favorable impact from these items was modestly offset by the expected run-off of
acquired home loans.
•Non-Interest Income: Non-interest income increased by $62 million, or 9%, in 2012. The increase was
primarily attributable to mark-to-market gains on retained interests in interest-only strips and negative
amortization mortgage securities recognized in the third quarter of 2012.
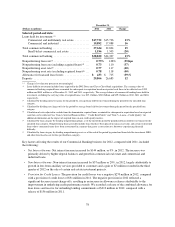
•Provision for Credit Losses: The provision for credit losses increased by $137 million in 2012 to
$589 million. The increase was largely due to higher auto loan balances, which more than offset the benefit
from lower net charge-off rates and continued credit performance improvement. We recorded an allowance
build of $59 million in 2012, compared with an allowance release of $23 million in 2011. As discussed
above in “Item 6. Selected Financial Data,” the substantial majority of the ING Direct home loan portfolio is
accounted for based on estimated cash flows expected to be collected over the life of the loans. Because the
credit mark established at acquisition for these loans takes into consideration future credit losses expected to
be incurred, there are no charge-offs or an allowance associated with these loans unless the estimated cash
flows expected to be collected decrease subsequent to acquisition.
•Non-Interest Expense: Non-interest expense increased by $627 million, or 19%, in 2012. The increase was
largely attributable to operating expenses related to ING Direct, merger-related expenses associated with the
acquisition and higher infrastructure expenditures resulting from continued investments in the home loan
business and growth in auto loan balances as a result of increased auto loan originations.
•Total Loans: Period-end loans in the Consumer Banking business increased by $38.8 billion, or 107%, in
2012 to $75.1 billion as of December 31, 2012, primarily due to the acquisition of $40.4 billion of ING
Direct home loans and growth in auto loan originations, which were partially offset by the expected
continued run-off of our acquired home loan portfolios.
75