Capital One 2012 Annual Report Download - page 61
Download and view the complete annual report
Please find page 61 of the 2012 Capital One annual report below. You can navigate through the pages in the report by either clicking on the pages listed below, or by using the keyword search tool below to find specific information within the annual report.-
 1
1 -
2
-
3
-
4
-
5
-
6
-
7
-
8
-
9
-
10
-
11
-
12
-
13
-
14
-
15
-
16
-
17
-
18
-
19
-
20
-
21
-
22
-
23
-
24
-
25
-
26
-
27
-
28
-
29
-
30
-
31
-
32
-
33
-
34
-
35
-
36
-
37
-
38
-
39
-
40
-
41
-
42
-
43
-
44
-
45
-
46
-
47
-
48
-
49
-
50
-
 51
51 -
 52
52 -
 53
53 -
 54
54 -
 55
55 -
 56
56 -
 57
57 -
 58
58 -
 59
59 -
 60
60 -
 61
61 -
 62
62 -
 63
63 -
 64
64 -
 65
65 -
 66
66 -
 67
67 -
 68
68 -
 69
69 -
 70
70 -
 71
71 -
72
-
73
-
74
-
75
-
76
-
77
-
78
-
79
-
80
-
81
-
82
-
83
-
84
-
85
-
86
-
87
-
88
-
89
-
90
-
91
-
92
-
93
-
94
-
95
-
96
-
97
-
98
-
99
-
100
-
101
-
102
-
103
-
104
-
105
-
106
-
107
-
108
-
109
-
110
-
111
-
112
-
113
-
114
-
115
-
116
-
117
-
118
-
119
-
120
-
121
-
122
-
123
-
124
-
125
-
126
-
127
-
128
-
129
-
130
-
131
-
132
-
133
-
134
-
135
-
136
-
137
-
138
-
139
-
140
-
141
-
142
-
143
-
144
-
145
-
146
-
147
-
148
-
149
-
150
-
151
-
152
-
153
-
154
-
155
-
156
-
157
-
158
-
159
-
160
-
161
-
162
-
163
-
164
-
165
-
166
-
167
-
168
-
169
-
170
-
171
-
172
-
173
-
174
-
175
-
176
-
177
-
178
-
179
-
180
-
181
-
182
-
183
-
184
-
185
-
186
-
187
-
188
-
189
-
190
-
191
-
192
-
193
-
194
-
195
-
196
-
197
-
198
-
199
-
200
-
201
-
202
-
203
-
204
-
205
-
206
-
207
-
208
-
209
-
210
-
211
-
212
-
213
-
214
-
215
-
216
-
217
-
218
-
219
-
220
-
221
-
222
-
223
-
224
-
225
-
226
-
227
-
228
-
229
-
230
-
231
-
232
-
233
-
234
-
235
-
236
-
237
-
238
-
239
-
240
-
241
-
242
-
243
-
244
-
245
-
246
-
247
-
248
-
249
-
250
-
251
-
252
-
253
-
254
-
255
-
256
-
257
-
258
-
259
-
260
-
261
-
262
-
263
-
264
-
265
-
266
-
267
-
268
-
269
-
270
-
271
-
272
-
273
-
274
-
275
-
276
-
277
-
278
-
279
-
280
-
281
-
282
-
283
-
284
-
285
-
286
-
287
-
288
-
289
-
290
-
291
-
292
-
293
-
294
-
295
-
296
-
297
-
298
-
299
-
300
-
301
-
302
-
303
-
304
-
305
-
306
-
307
-
308
-
309
-
310
-
311
 |
 |

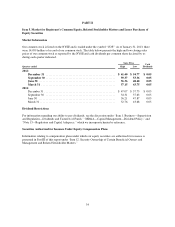
Item 7. Management’s Discussion and Analysis of Financial Condition and Results of Operations
This discussion contains forward-looking statements that are based upon management’s current expectations
and are subject to significant uncertainties and changes in circumstances. Please review “Forward-Looking
Statements” for more information on the forward-looking statements in this Report. Our actual results may differ
materially from those included in these forward-looking statements due to a variety of factors including, but not
limited to, those described in this Report in “Item 1A. Risk Factors.” Unless otherwise specified, references to
Notes to our consolidated financial statements are to the Notes to our audited consolidated financial statements
as of December 31, 2012 included in this 2012 Annual Report on Form 10-K (“2012 Form 10-K).
Management monitors a variety of key indicators to evaluate our business results and financial condition. The
following MD&A is intended to provide the reader with an understanding of our results of operations, financial
condition and liquidity by focusing on changes from year to year in certain key measures used by management to
evaluate performance, such as profitability, growth and credit quality metrics. MD&A is provided as a
supplement to, and should be read in conjunction with, our audited consolidated financial statements as of
December 31, 2012 and accompanying notes. MD&A is organized in the following sections:
• Overview
• Executive Summary and Business Outlook
• Critical Accounting Policies and Estimates
• Accounting Changes and Developments
• Consolidated Results of Operations
• Business Segment Financial Performance
• Consolidated Balance Sheet Analysis
• Off-Balance Sheet Arrangements and Variable
Interest Entities
• Capital Management
• Risk Management
• Credit Risk Profile
• Liquidity Risk Profile
• Market Risk Profile
• Supplemental Tables
OVERVIEW
We are a diversified financial services holding company with banking and non-banking subsidiaries that offer a
broad array of financial products and services to consumers, small businesses and commercial clients through
branches, the internet and other distribution channels. Our principal subsidiaries included Capital One Bank
(USA), National Association (“COBNA”) and Capital One, National Association (“CONA”) as of December 31,
2012. On November 1, 2012, we merged ING Bank, fsb into CONA, with CONA surviving the merger. The
Company and its subsidiaries are hereafter collectively referred to as “we,” “us” or “our.” CONA and COBNA
are hereafter collectively referred to as the “Banks.”
Period-end loans held for investment increased to $205.9 billion and deposits increased to $212.5 billion as of
December 31, 2012, from period-end loans of $135.9 billion and deposits of $128.2 billion as of December 31,
2011. The closing of the ING Direct acquisition on February 17, 2012 resulted in the addition of loans of
$40.4 billion and other assets of $53.9 billion at acquisition. The ING Direct acquisition, which added over seven
million customers and approximately $84.4 billion in deposits to our Consumer Banking business segment as of
the acquisition date, strengthens our customer franchise. With the ING Direct acquisition, we have grown to
become the sixth largest depository institution and the largest direct banking institution in the United States. The
closing of the 2012 U.S. card acquisition on May 1, 2012 added approximately 27 million new active accounts
and approximately $27.8 billion in outstanding credit card receivables as of the acquisition date that we
designated as held for investment.
Our consolidated total net revenues are derived primarily from lending to consumer and commercial customers
and by deposit-taking activities net of the costs associated with funding our assets, which generate net interest
income, and by activities that generate non-interest income, such as fee-based services provided to customers and
42