Capital One 2012 Annual Report Download - page 84
Download and view the complete annual report
Please find page 84 of the 2012 Capital One annual report below. You can navigate through the pages in the report by either clicking on the pages listed below, or by using the keyword search tool below to find specific information within the annual report.-
 1
1 -
2
-
3
-
4
-
5
-
6
-
7
-
8
-
9
-
10
-
11
-
12
-
13
-
14
-
15
-
16
-
17
-
18
-
19
-
20
-
21
-
22
-
23
-
24
-
25
-
26
-
27
-
28
-
29
-
30
-
31
-
32
-
33
-
34
-
35
-
36
-
37
-
38
-
39
-
40
-
41
-
42
-
43
-
44
-
45
-
46
-
47
-
48
-
49
-
50
-
51
-
52
-
53
-
54
-
55
-
56
-
57
-
58
-
59
-
60
-
61
-
62
-
63
-
64
-
65
-
66
-
67
-
68
-
69
-
70
-
71
-
72
-
73
-
 74
74 -
 75
75 -
 76
76 -
 77
77 -
 78
78 -
 79
79 -
 80
80 -
 81
81 -
 82
82 -
 83
83 -
 84
84 -
 85
85 -
 86
86 -
 87
87 -
 88
88 -
 89
89 -
 90
90 -
 91
91 -
 92
92 -
 93
93 -
 94
94 -
95
-
96
-
97
-
98
-
99
-
100
-
101
-
102
-
103
-
104
-
105
-
106
-
107
-
108
-
109
-
110
-
111
-
112
-
113
-
114
-
115
-
116
-
117
-
118
-
119
-
120
-
121
-
122
-
123
-
124
-
125
-
126
-
127
-
128
-
129
-
130
-
131
-
132
-
133
-
134
-
135
-
136
-
137
-
138
-
139
-
140
-
141
-
142
-
143
-
144
-
145
-
146
-
147
-
148
-
149
-
150
-
151
-
152
-
153
-
154
-
155
-
156
-
157
-
158
-
159
-
160
-
161
-
162
-
163
-
164
-
165
-
166
-
167
-
168
-
169
-
170
-
171
-
172
-
173
-
174
-
175
-
176
-
177
-
178
-
179
-
180
-
181
-
182
-
183
-
184
-
185
-
186
-
187
-
188
-
189
-
190
-
191
-
192
-
193
-
194
-
195
-
196
-
197
-
198
-
199
-
200
-
201
-
202
-
203
-
204
-
205
-
206
-
207
-
208
-
209
-
210
-
211
-
212
-
213
-
214
-
215
-
216
-
217
-
218
-
219
-
220
-
221
-
222
-
223
-
224
-
225
-
226
-
227
-
228
-
229
-
230
-
231
-
232
-
233
-
234
-
235
-
236
-
237
-
238
-
239
-
240
-
241
-
242
-
243
-
244
-
245
-
246
-
247
-
248
-
249
-
250
-
251
-
252
-
253
-
254
-
255
-
256
-
257
-
258
-
259
-
260
-
261
-
262
-
263
-
264
-
265
-
266
-
267
-
268
-
269
-
270
-
271
-
272
-
273
-
274
-
275
-
276
-
277
-
278
-
279
-
280
-
281
-
282
-
283
-
284
-
285
-
286
-
287
-
288
-
289
-
290
-
291
-
292
-
293
-
294
-
295
-
296
-
297
-
298
-
299
-
300
-
301
-
302
-
303
-
304
-
305
-
306
-
307
-
308
-
309
-
310
-
311
 |
 |

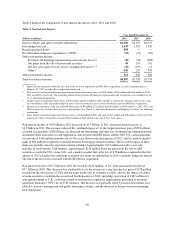
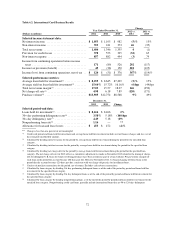
million, primarily related to the non-taxable ING Direct bargain purchase gain of $594 million, a one-time
deferred tax benefit for changes in our state tax position resulting from the assets and operations of the 2012 U.S.
card acquisition and consolidation of ING Bank, fsb with our existing banking operations, and the resolution of
certain tax issues and audits. In comparison, in 2011 we recorded discrete tax benefits of $121 million, primarily
related to the release of valuation allowances against certain state deferred tax assets and net operating loss carry-
forwards, as well as the resolution of certain tax issues and audits.
Similarly, the decrease in our effective income tax rate in 2011 from 2010 reflected an increase in the amount of
one-time tax benefits recorded in 2011 compared with the prior year. In 2011, we recorded discrete tax benefits
of $121 million, primarily related to the release of valuation allowances against certain state deferred tax assets
and net operating loss carry-forwards, as well as the resolution of certain tax issues and audits. In 2010, we
recorded discrete tax benefits of $84 million, primarily related to adjustments for the resolution of certain tax
issues and audits.
Our effective income tax rate excluding the benefit from these discrete tax items was 30.9%, 31.7% and 31.5%
for 2012, 2011 and 2010, respectively. The decrease in our effective income tax rate excluding the impact of
discrete items in 2012 from 2011 was primarily due to an increase in affordable housing and other business tax
credits.
We provide additional information on items affecting our income taxes and effective tax rate in “Note 18—
Income Taxes.”
Loss from Discontinued Operations, Net of Tax
Loss from discontinued operations reflects ongoing costs, which primarily consist of mortgage loan repurchase
representation and warranty charges related to the mortgage origination operations of GreenPoint’s wholesale
mortgage banking unit, which we closed in 2007.
We recorded a loss from discontinued operations, net of tax, of $217 million, $106 million and $307 million in
2012, 2011 and 2010, respectively. The variance in the loss from discontinued operations between 2012 and 2011
and between 2011 and 2010 is attributable to the provision for mortgage representation and warranty losses. We
recorded a total pre-tax provision for mortgage representation and warranty losses of $349 million, $212 million
and $636 million in 2012, 2011 and 2010, respectively. The portion of these amounts included in loss from
discontinued operations totaled $307 million ($194 million net of tax) in 2012, $169 million ($120 million net of
tax) in 2011 and $432 million ($304 million net of tax) in 2010.
We provide additional information on the provision for mortgage representation and warranty losses and the
related reserve for potential representation and warranty claims in “Critical Accounting Polices and Estimates”
and “Note 21—Commitments, Contingencies and Guarantees.”
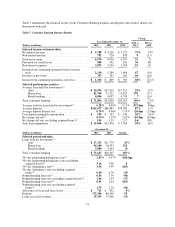
BUSINESS SEGMENT FINANCIAL PERFORMANCE
Our principal operations are currently organized into three major business segments, which are defined based on
the products and services provided or the type of customer served: Credit Card, Consumer Banking and
Commercial Banking. The operations of acquired businesses have been integrated into our existing business
segments. Certain activities that are not part of a segment, such as management of our corporate investment
portfolio and asset/liability management by our centralized Corporate Treasury group, are included in the
“Other” category.
The results of our individual businesses, which we report on a continuing operations basis, reflect the manner in
which management evaluates performance and makes decisions about funding our operations and allocating
65