Capital One 2012 Annual Report Download - page 134
Download and view the complete annual report
Please find page 134 of the 2012 Capital One annual report below. You can navigate through the pages in the report by either clicking on the pages listed below, or by using the keyword search tool below to find specific information within the annual report.-
 1
1 -
2
-
3
-
4
-
5
-
6
-
7
-
8
-
9
-
10
-
11
-
12
-
13
-
14
-
15
-
16
-
17
-
18
-
19
-
20
-
21
-
22
-
23
-
24
-
25
-
26
-
27
-
28
-
29
-
30
-
31
-
32
-
33
-
34
-
35
-
36
-
37
-
38
-
39
-
40
-
41
-
42
-
43
-
44
-
45
-
46
-
47
-
48
-
49
-
50
-
51
-
52
-
53
-
54
-
55
-
56
-
57
-
58
-
59
-
60
-
61
-
62
-
63
-
64
-
65
-
66
-
67
-
68
-
69
-
70
-
71
-
72
-
73
-
74
-
75
-
76
-
77
-
78
-
79
-
80
-
81
-
82
-
83
-
84
-
85
-
86
-
87
-
88
-
89
-
90
-
91
-
92
-
93
-
94
-
95
-
96
-
97
-
98
-
99
-
100
-
101
-
102
-
103
-
104
-
105
-
106
-
107
-
108
-
109
-
110
-
111
-
112
-
113
-
114
-
115
-
116
-
117
-
118
-
119
-
120
-
121
-
122
-
123
-
 124
124 -
 125
125 -
 126
126 -
 127
127 -
 128
128 -
 129
129 -
 130
130 -
 131
131 -
 132
132 -
 133
133 -
 134
134 -
 135
135 -
 136
136 -
 137
137 -
 138
138 -
 139
139 -
 140
140 -
 141
141 -
 142
142 -
 143
143 -
 144
144 -
145
-
146
-
147
-
148
-
149
-
150
-
151
-
152
-
153
-
154
-
155
-
156
-
157
-
158
-
159
-
160
-
161
-
162
-
163
-
164
-
165
-
166
-
167
-
168
-
169
-
170
-
171
-
172
-
173
-
174
-
175
-
176
-
177
-
178
-
179
-
180
-
181
-
182
-
183
-
184
-
185
-
186
-
187
-
188
-
189
-
190
-
191
-
192
-
193
-
194
-
195
-
196
-
197
-
198
-
199
-
200
-
201
-
202
-
203
-
204
-
205
-
206
-
207
-
208
-
209
-
210
-
211
-
212
-
213
-
214
-
215
-
216
-
217
-
218
-
219
-
220
-
221
-
222
-
223
-
224
-
225
-
226
-
227
-
228
-
229
-
230
-
231
-
232
-
233
-
234
-
235
-
236
-
237
-
238
-
239
-
240
-
241
-
242
-
243
-
244
-
245
-
246
-
247
-
248
-
249
-
250
-
251
-
252
-
253
-
254
-
255
-
256
-
257
-
258
-
259
-
260
-
261
-
262
-
263
-
264
-
265
-
266
-
267
-
268
-
269
-
270
-
271
-
272
-
273
-
274
-
275
-
276
-
277
-
278
-
279
-
280
-
281
-
282
-
283
-
284
-
285
-
286
-
287
-
288
-
289
-
290
-
291
-
292
-
293
-
294
-
295
-
296
-
297
-
298
-
299
-
300
-
301
-
302
-
303
-
304
-
305
-
306
-
307
-
308
-
309
-
310
-
311
 |
 |
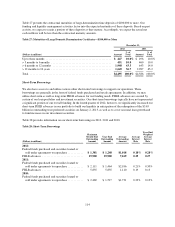
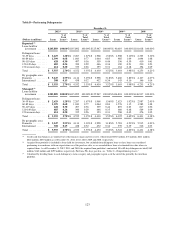
Other Funding Sources
We also access the capital markets to meet our funding needs through the use of federal funds purchased and
securities loaned or sold under agreements to repurchase, the issuance of senior and subordinated notes, other
borrowings, and loan securitization transactions. In addition, we utilize advances from the FHLB for our funding
needs. FHLB advances are secured by certain of our loan portfolios and investment securities.
Our debt, including federal funds purchased and securities loaned or sold under agreements to repurchase, senior
and subordinated notes and other borrowings, such as FHLB advances, but excluding securitized debt
obligations, totaled $38.5 billion as of December 31, 2012, up from $23.0 billion as of December 31, 2011. The
$15.5 billion increase in our debt, excluding securitized debt obligations, was primarily attributable to the
proceeds of approximately $2.3 billion from the issuance of senior notes, a $14.1 billion increase in short-term
FHLB advances, as well as a decrease of $632 million due to the maturity of one senior note.
We regularly participate in the federal funds market to take advantage of attractive offers and to keep a visible
presence in the market, which is intended to ensure that we are able to access the federal funds market in a time
of need. We expect monthly fluctuations in our borrowings, as borrowing amounts are highly dependent on our
counterparties’ cash positions.
Table 29 presents our short-term borrowings, long-term debt and the maturity profile based on expected
maturities as of December 31, 2012. We provide additional information on our short-term borrowings and long-
term debt in “Note 10—Deposits and Borrowings.”
Table 29: Contractual Maturity Profile of Short-term Borrowings and Long-term Debt
December 31, 2012
(Dollars in millions)
Up to
1 Year
> 1 Year
to 2 Years
> 2 Years
to 3 Years
> 3 Years
to 4 Years
> 4 Years
to 5 Years > 5 Years Total
Short-term borrowings:
Federal funds purchased and
securities loaned or sold under
agreements to repurchase ....... $ 1,248 $ — $ — $ — $ — $ — $ 1,248
FHLB advances ............. 19,900 —————19,900
Total short-term borrowings ....... 21,148 —————21,148
Long-term debt:
Securitized debt obligations ....... 2,628 2,900 502 1,329 3,764 275 11,398
Senior and subordinated notes:
Unsecured senior debt ........ 285 2,313 2,663 760 1,793 1,309 9,123
Unsecured subordinated debt . . 507 104 — 1,174 0 1,778 3,563
Total senior and subordinated
notes ....................... 792 2,417 2,663 1,934 1,793 3,087 12,686
Other long-term borrowings:
Junior subordinated debt ...... —————3,641 3,641
FHLB advances ............. 16 945 22 20 19 15 1,037
Total other long-term borrowings . . . 16 945 22 20 19 3,656 4,678
Total long-term debt(1) ........... 3,436 6,262 3,187 3,283 5,576 7,018 28,762
Total short-term borrowings and
long-term debt ................ $24,584 $6,262 $3,187 $3,283 $5,576 $7,018 $49,910
Percentage of total .............. 49% 13% 6% 7% 11% 14% 100%
(1) Includes unamortized discounts, premiums and other cost basis adjustments of $30 million as of December 31, 2012.
115