Capital One 2012 Annual Report Download - page 265
Download and view the complete annual report
Please find page 265 of the 2012 Capital One annual report below. You can navigate through the pages in the report by either clicking on the pages listed below, or by using the keyword search tool below to find specific information within the annual report.-
 1
1 -
2
-
3
-
4
-
5
-
6
-
7
-
8
-
9
-
10
-
11
-
12
-
13
-
14
-
15
-
16
-
17
-
18
-
19
-
20
-
21
-
22
-
23
-
24
-
25
-
26
-
27
-
28
-
29
-
30
-
31
-
32
-
33
-
34
-
35
-
36
-
37
-
38
-
39
-
40
-
41
-
42
-
43
-
44
-
45
-
46
-
47
-
48
-
49
-
50
-
51
-
52
-
53
-
54
-
55
-
56
-
57
-
58
-
59
-
60
-
61
-
62
-
63
-
64
-
65
-
66
-
67
-
68
-
69
-
70
-
71
-
72
-
73
-
74
-
75
-
76
-
77
-
78
-
79
-
80
-
81
-
82
-
83
-
84
-
85
-
86
-
87
-
88
-
89
-
90
-
91
-
92
-
93
-
94
-
95
-
96
-
97
-
98
-
99
-
100
-
101
-
102
-
103
-
104
-
105
-
106
-
107
-
108
-
109
-
110
-
111
-
112
-
113
-
114
-
115
-
116
-
117
-
118
-
119
-
120
-
121
-
122
-
123
-
124
-
125
-
126
-
127
-
128
-
129
-
130
-
131
-
132
-
133
-
134
-
135
-
136
-
137
-
138
-
139
-
140
-
141
-
142
-
143
-
144
-
145
-
146
-
147
-
148
-
149
-
150
-
151
-
152
-
153
-
154
-
155
-
156
-
157
-
158
-
159
-
160
-
161
-
162
-
163
-
164
-
165
-
166
-
167
-
168
-
169
-
170
-
171
-
172
-
173
-
174
-
175
-
176
-
177
-
178
-
179
-
180
-
181
-
182
-
183
-
184
-
185
-
186
-
187
-
188
-
189
-
190
-
191
-
192
-
193
-
194
-
195
-
196
-
197
-
198
-
199
-
200
-
201
-
202
-
203
-
204
-
205
-
206
-
207
-
208
-
209
-
210
-
211
-
212
-
213
-
214
-
215
-
216
-
217
-
218
-
219
-
220
-
221
-
222
-
223
-
224
-
225
-
226
-
227
-
228
-
229
-
230
-
231
-
232
-
233
-
234
-
235
-
236
-
237
-
238
-
239
-
240
-
241
-
242
-
243
-
244
-
245
-
246
-
247
-
248
-
249
-
250
-
251
-
252
-
253
-
254
-
 255
255 -
 256
256 -
 257
257 -
 258
258 -
 259
259 -
 260
260 -
 261
261 -
 262
262 -
 263
263 -
 264
264 -
 265
265 -
 266
266 -
 267
267 -
 268
268 -
 269
269 -
 270
270 -
 271
271 -
 272
272 -
 273
273 -
 274
274 -
 275
275 -
276
-
277
-
278
-
279
-
280
-
281
-
282
-
283
-
284
-
285
-
286
-
287
-
288
-
289
-
290
-
291
-
292
-
293
-
294
-
295
-
296
-
297
-
298
-
299
-
300
-
301
-
302
-
303
-
304
-
305
-
306
-
307
-
308
-
309
-
310
-
311
 |
 |
CAPITAL ONE FINANCIAL CORPORATION
NOTES TO CONSOLIDATED FINANCIAL STATEMENTS—(Continued)
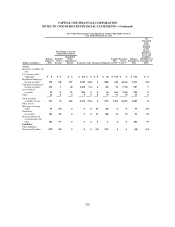
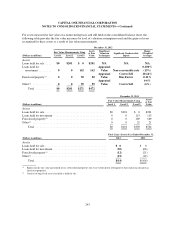
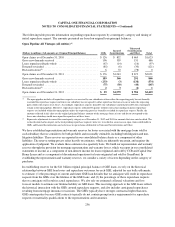
The significant unobservable inputs used in the fair value measurement of our residential, asset-backed and
commercial securities include yield, prepayment rate, default rate and loss severity in the event of default.
Significant increases (decreases) in any of those inputs in isolation or combination would result in a significant
change in fair value measurement. Generally, an increase in the yield assumption will result in a decrease in fair
value measurement, however, an increase or decrease in prepayment rate, default rate or loss severity may have a
different impact on the fair value given various characteristics of the security including the capital structure of
the deal, credit enhancement for the security or other factors.
As of December 31, 2012, we saw further improvements in the market value of our portfolio holdings driven by
lower interest rates and reduced risk premiums as compared to 2011. The increase in the amount of Level 3
securities was primarily driven by the increase in non-agency MBS securities due to acquisition of ING Direct
securities portfolio.
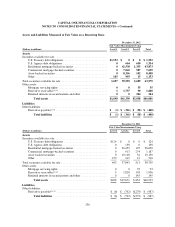
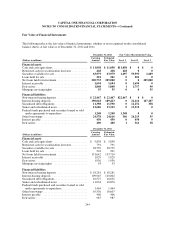
Loans Held For Sale
The fair value of loans held for sale is determined using current secondary market prices for portfolios with
similar characteristics. The carrying amounts as of December 31, 2012 and 2011 approximate fair value.
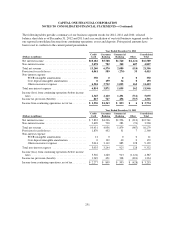
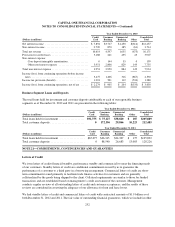
Loans Held For Investment, Net
The fair values of credit card loans, installment loans, auto loans, home loans and commercial loans were
estimated using a discounted cash flow method, a form of the income approach. Discount rates were determined
considering rates at which similar portfolios of loans would be made under current conditions and considering
liquidity spreads applicable to each loan portfolio based on the secondary market. The fair value of credit card
loans excluded any value related to customer account relationships. The increase in fair value above carrying
amount as of December 31, 2012 was primarily due to a tightening of liquidity spreads and improved credit
performance noted in our mortgage and commercial loan portfolios.
Interest Receivable
The carrying amount of interest receivable approximates the fair value of this asset due to its relatively short-
term nature.
Derivative Receivables and Payables
We use both exchange-traded derivatives and over-the-counter (“OTC”) derivatives to manage our interest rate
and foreign currency risk exposure. Quoted market prices are available and used for our exchange-traded
derivatives, which we classify as Level 1. However, substantially all of our derivatives are traded in OTC
markets where quoted market prices are not always readily available. Therefore, we value most OTC derivatives
using valuation techniques, which include internally-developed models. We primarily rely on market observable
inputs for our models, such as interest rate yield curves, credit curves, option volatility and currency rates, that
vary depending on the type of derivative and nature of the underlying rate, price or index upon which the
derivative’s value is based. Where model inputs can be observed in a liquid market and the model does not
require significant judgment, such derivatives are typically classified as Level 2 of the fair value hierarchy. When
instruments are traded in less liquid markets and significant inputs are unobservable, such as interest rate swaps
whose remaining terms do not correlate with market observable interest rate yield curves, the derivatives are
classified as Level 3.
246