Capital One 2012 Annual Report Download - page 262
Download and view the complete annual report
Please find page 262 of the 2012 Capital One annual report below. You can navigate through the pages in the report by either clicking on the pages listed below, or by using the keyword search tool below to find specific information within the annual report.-
 1
1 -
2
-
3
-
4
-
5
-
6
-
7
-
8
-
9
-
10
-
11
-
12
-
13
-
14
-
15
-
16
-
17
-
18
-
19
-
20
-
21
-
22
-
23
-
24
-
25
-
26
-
27
-
28
-
29
-
30
-
31
-
32
-
33
-
34
-
35
-
36
-
37
-
38
-
39
-
40
-
41
-
42
-
43
-
44
-
45
-
46
-
47
-
48
-
49
-
50
-
51
-
52
-
53
-
54
-
55
-
56
-
57
-
58
-
59
-
60
-
61
-
62
-
63
-
64
-
65
-
66
-
67
-
68
-
69
-
70
-
71
-
72
-
73
-
74
-
75
-
76
-
77
-
78
-
79
-
80
-
81
-
82
-
83
-
84
-
85
-
86
-
87
-
88
-
89
-
90
-
91
-
92
-
93
-
94
-
95
-
96
-
97
-
98
-
99
-
100
-
101
-
102
-
103
-
104
-
105
-
106
-
107
-
108
-
109
-
110
-
111
-
112
-
113
-
114
-
115
-
116
-
117
-
118
-
119
-
120
-
121
-
122
-
123
-
124
-
125
-
126
-
127
-
128
-
129
-
130
-
131
-
132
-
133
-
134
-
135
-
136
-
137
-
138
-
139
-
140
-
141
-
142
-
143
-
144
-
145
-
146
-
147
-
148
-
149
-
150
-
151
-
152
-
153
-
154
-
155
-
156
-
157
-
158
-
159
-
160
-
161
-
162
-
163
-
164
-
165
-
166
-
167
-
168
-
169
-
170
-
171
-
172
-
173
-
174
-
175
-
176
-
177
-
178
-
179
-
180
-
181
-
182
-
183
-
184
-
185
-
186
-
187
-
188
-
189
-
190
-
191
-
192
-
193
-
194
-
195
-
196
-
197
-
198
-
199
-
200
-
201
-
202
-
203
-
204
-
205
-
206
-
207
-
208
-
209
-
210
-
211
-
212
-
213
-
214
-
215
-
216
-
217
-
218
-
219
-
220
-
221
-
222
-
223
-
224
-
225
-
226
-
227
-
228
-
229
-
230
-
231
-
232
-
233
-
234
-
235
-
236
-
237
-
238
-
239
-
240
-
241
-
242
-
243
-
244
-
245
-
246
-
247
-
248
-
249
-
250
-
251
-
 252
252 -
 253
253 -
 254
254 -
 255
255 -
 256
256 -
 257
257 -
 258
258 -
 259
259 -
 260
260 -
 261
261 -
 262
262 -
 263
263 -
 264
264 -
 265
265 -
 266
266 -
 267
267 -
 268
268 -
 269
269 -
 270
270 -
 271
271 -
 272
272 -
273
-
274
-
275
-
276
-
277
-
278
-
279
-
280
-
281
-
282
-
283
-
284
-
285
-
286
-
287
-
288
-
289
-
290
-
291
-
292
-
293
-
294
-
295
-
296
-
297
-
298
-
299
-
300
-
301
-
302
-
303
-
304
-
305
-
306
-
307
-
308
-
309
-
310
-
311
 |
 |

CAPITAL ONE FINANCIAL CORPORATION
NOTES TO CONSOLIDATED FINANCIAL STATEMENTS—(Continued)
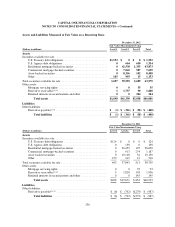
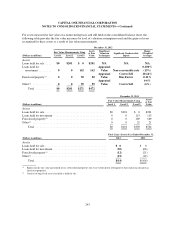
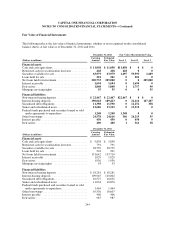
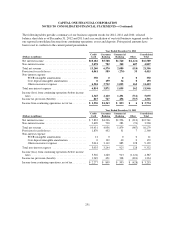
For assets measured at fair value on a nonrecurring basis and still held on the consolidated balance sheet, the
following table provides the fair value measures by level of valuation assumptions used and the gains or losses
recognized for these assets as a result of fair value measurements.
December 31, 2012
Fair Value Measurements Using Assets
at Fair
Value
Significant
Valuation
Techniques
Significant Unobservable
Inputs
Range
(Weighted
Average)(Dollars in millions) Level 1 Level 2 Level 3
Assets
Loans held for sale .... $0 $201 $ 0 $201 N/A N/A N/A
Loans held for
investment ......... 0 0 162 162
Appraisal
Value Non-recoverable rate
0-100%
(13%)
Foreclosed property(1) .. 0 0 50 50
Appraisal
Value
Cost to Sell
Bias Factor
10-14%
0-11%
Other(2) ............. 0 0 59 59
Appraisal
Value Cost to Sell
6-6%
(6%)
Total ........... $0 $201 $271 $472
December 31, 2011
Fair Value Measurements Using Assets
at Fair
Value(Dollars in millions) Level 1 Level 2 Level 3
Assets
Loans held for sale ......................................... $0 $201 $ 0 $201
Loans held for investment ................................... 0 0 113 113
Foreclosed property(1) ...................................... 0 0 169 169
Other(2) .................................................. 0 0 21 21
Total ................................................ $0 $201 $303 $504
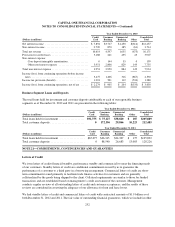
Total Gains (Losses)Year Ended December 31,
(Dollars in millions) 2012 2011
Assets
Loans held for sale ........................................... $0 $0
Loans held for investment ..................................... (50) (66)
Foreclosed property(1) ........................................ (12) (21)
Other(2) .................................................... (19) (19)
Total .................................................. $(14) $(106)
(1) Represents the fair value and related losses of foreclosed properties that were written down subsequent to their initial classification as
foreclosed properties.
(2) Consists of long lived assets classified as held for sale.
243