Capital One 2012 Annual Report Download - page 54
Download and view the complete annual report
Please find page 54 of the 2012 Capital One annual report below. You can navigate through the pages in the report by either clicking on the pages listed below, or by using the keyword search tool below to find specific information within the annual report.-
 1
1 -
2
-
3
-
4
-
5
-
6
-
7
-
8
-
9
-
10
-
11
-
12
-
13
-
14
-
15
-
16
-
17
-
18
-
19
-
20
-
21
-
22
-
23
-
24
-
25
-
26
-
27
-
28
-
29
-
30
-
31
-
32
-
33
-
34
-
35
-
36
-
37
-
38
-
39
-
40
-
41
-
42
-
43
-
 44
44 -
 45
45 -
 46
46 -
 47
47 -
 48
48 -
 49
49 -
 50
50 -
 51
51 -
 52
52 -
 53
53 -
 54
54 -
 55
55 -
 56
56 -
 57
57 -
 58
58 -
 59
59 -
 60
60 -
 61
61 -
 62
62 -
 63
63 -
 64
64 -
65
-
66
-
67
-
68
-
69
-
70
-
71
-
72
-
73
-
74
-
75
-
76
-
77
-
78
-
79
-
80
-
81
-
82
-
83
-
84
-
85
-
86
-
87
-
88
-
89
-
90
-
91
-
92
-
93
-
94
-
95
-
96
-
97
-
98
-
99
-
100
-
101
-
102
-
103
-
104
-
105
-
106
-
107
-
108
-
109
-
110
-
111
-
112
-
113
-
114
-
115
-
116
-
117
-
118
-
119
-
120
-
121
-
122
-
123
-
124
-
125
-
126
-
127
-
128
-
129
-
130
-
131
-
132
-
133
-
134
-
135
-
136
-
137
-
138
-
139
-
140
-
141
-
142
-
143
-
144
-
145
-
146
-
147
-
148
-
149
-
150
-
151
-
152
-
153
-
154
-
155
-
156
-
157
-
158
-
159
-
160
-
161
-
162
-
163
-
164
-
165
-
166
-
167
-
168
-
169
-
170
-
171
-
172
-
173
-
174
-
175
-
176
-
177
-
178
-
179
-
180
-
181
-
182
-
183
-
184
-
185
-
186
-
187
-
188
-
189
-
190
-
191
-
192
-
193
-
194
-
195
-
196
-
197
-
198
-
199
-
200
-
201
-
202
-
203
-
204
-
205
-
206
-
207
-
208
-
209
-
210
-
211
-
212
-
213
-
214
-
215
-
216
-
217
-
218
-
219
-
220
-
221
-
222
-
223
-
224
-
225
-
226
-
227
-
228
-
229
-
230
-
231
-
232
-
233
-
234
-
235
-
236
-
237
-
238
-
239
-
240
-
241
-
242
-
243
-
244
-
245
-
246
-
247
-
248
-
249
-
250
-
251
-
252
-
253
-
254
-
255
-
256
-
257
-
258
-
259
-
260
-
261
-
262
-
263
-
264
-
265
-
266
-
267
-
268
-
269
-
270
-
271
-
272
-
273
-
274
-
275
-
276
-
277
-
278
-
279
-
280
-
281
-
282
-
283
-
284
-
285
-
286
-
287
-
288
-
289
-
290
-
291
-
292
-
293
-
294
-
295
-
296
-
297
-
298
-
299
-
300
-
301
-
302
-
303
-
304
-
305
-
306
-
307
-
308
-
309
-
310
-
311
 |
 |

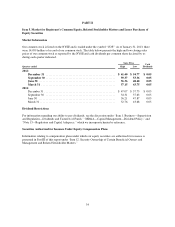
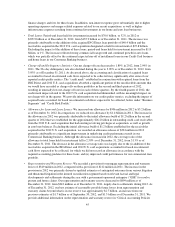
Common Stock Performance Graph
The following graph shows the cumulative total stockholder return on our common stock compared with an
overall stock market index, the S&P Composite 500 Stock Index (“S&P 500 Index”), and a published industry
index, the S&P Financial Composite Index (“S&P Financial Index”), over the five-year period commencing
December 31, 2007, and ending December 31, 2012. The stock performance graph assumes that $100 was
invested in our common stock and each index and that all dividends were reinvested. The stock price
performance on the graph below is not necessarily indicative of future performance.
Comparison of 5-Year Cumulative Total Return
(Capital One, S&P 500 Index and S&P Financial Index)
12/31/2007 12/31/2008 12/31/2009 12/31/2010 12/31/2011 12/31/2012
$140 $132
$97
$56
$120
$100
$80
$60
$40
$20
$0
Capital One S&P 500 Index S&P Financial Index
2007 2008 2009 2010 2011 2012
Capital One .................................. $100.00 $69.81 $86.51 $96.52 $96.32 $132.44
S&P 500 Index ............................... 100.00 61.51 75.94 85.65 85.65 97.13
S&P Financial Index ........................... 100.00 43.05 49.42 54.78 44.69 56.43
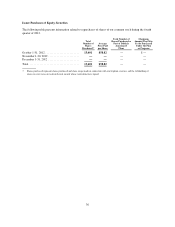
Recent Sales of Unregistered Securities
On February 17, 2012, in connection with the closing of the ING Direct acquisition, we issued 54,028,086 shares
of common stock to ING Bank N.V. as partial consideration for the acquisition in reliance on the exemption from
registration provided by Section 4(2) of the Securities Act of 1933, as amended. On September 10, 2012, one of
the ING Sellers sold 54,028,086 shares of our common stock in an underwritten public offering, representing all
of the shares of common stock we issued to the ING Sellers in connection with the ING Direct acquisition. We
did not receive any proceeds from this offering.
35